OTEP-0239: プロファイルデータフォーマット
OpenTelemetryにプロファイルシグナルのためのデータモデルを導入します。
動機
これは、さまざまな種類のアプリケーションやシステムに由来するプロファイルを表現できるようにする、データモデルとセマンティック規約の提案です。 既存のプロファイリングフォーマットは、このデータモデルへ曖昧さなくマッピングできます。 対象のプロファイリングフォーマットが同等の機能を備えている限り、このデータモデルからの逆方向のマッピングも可能です。
このデータモデルの目的は、プロファイルとは何か、プロファイリングシステムがどのようなデータを記録・転送・保存・解釈する必要があるかについて、共通の理解を持つことです。
設計に関する注記
設計目標
これらの目標は、プロファイリングビジョンOTEPで示されたビジョンに基づいています。
- プロファイリングを他のシグナルと互換性のあるものにします。
- 業界全体での共有と再利用のために、プロファイリングデータモデルを標準化します。
- プロファイラーは、OpenTelemetry全体のランタイムオーバーヘッド・侵襲性・ワイヤーデータサイズの要件に適合しつつ、低オーバーヘッドで実装可能でなければなりません(MUST)。
最後の点は、プロファイリングという文脈においては特に重要です。 プロファイラーは大量のデータを生成し、プロファイリング技術のユーザーはプロファイリングが持ち込むオーバーヘッドに非常に敏感です。 過去には、高いオーバーヘッドが継続的プロファイリングのより広い採用を妨げる要因となっており、それがプロファイリングが本番環境で使われてこなかった理由の1つでした。 そのため、クライアント側および仲介者(コレクターなど)においてプロファイリングデータを扱う際のオーバーヘッドを最小限に抑えることが重要です。
データモデル
このセクションでは、プロファイルデータを表現するために使われるさまざまなprotobufメッセージについて説明します。
関係図
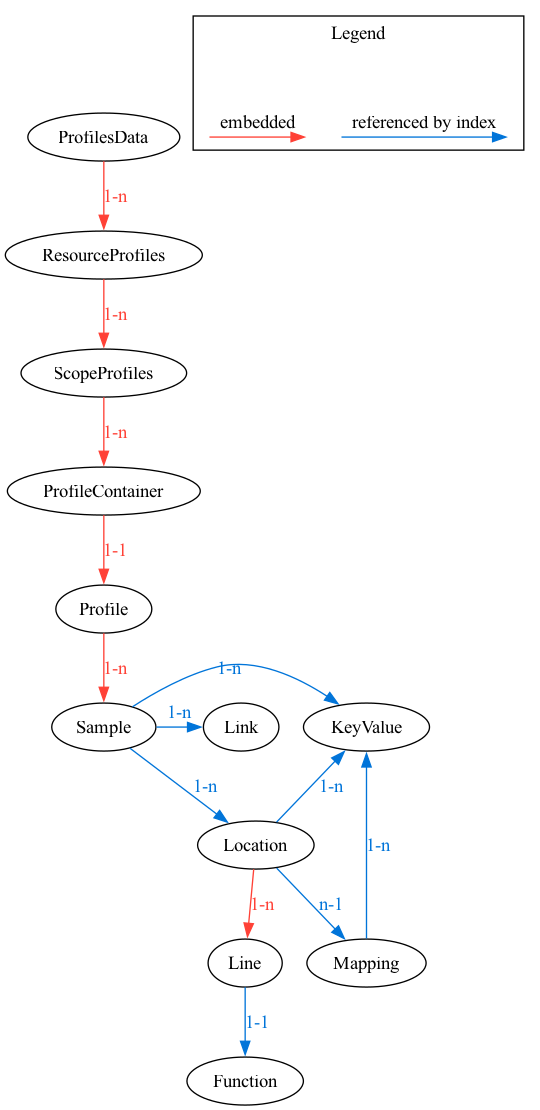
以下の図は、各メッセージ間の関係を示しています。 メッセージ間の関係は、あるメッセージを別のメッセージに埋め込む方式(赤い矢印)か、ルックアップテーブル内のインデックスによって別のメッセージを参照する方式(青い矢印)のいずれかで表現されます。 詳細は後述のメッセージ間の関係セクションを参照してください。
これに加えて、samplesとlocationsの間の関係は、パフォーマンスを高めるためにさらに最適化されています。
詳細は後述のサンプルとロケーション間の関係セクションを参照してください。
他のシグナルとの関係
プロファイルと他のシグナルの間には、次の2種類の関係があります。
- 他のシグナルからプロファイルへの関係(ログレコード、exemplar、トレーススパンなどから)
- プロファイルから他のシグナルへの関係
プロファイルから他のシグナルへ
Linkは、プロファイルのSampleとトレーススパンの間の接続を表現するために使われるメッセージです。
識別子としてtrace_idとspan_idを使用します。
ログやメトリクスなどの他のシグナルについても、それらのシグナルとトレースの間のリンク方法(trace_idとspan_id)が同じであるため、この同じ情報を使ってプロファイルと他のシグナルを相関させることができます。
他のシグナルからプロファイルへ
他のシグナルは、profile_idを使ってプロファイルを参照できます。
たとえば、ログレコードは、そのログレコードが生成された時点で収集されたプロファイルを、profile_idを属性の1つとして使うことで参照できます。
これにより、ログとプロファイルを相関させることができます。
さらに、SampleはLinkによってこれらと同じ識別子を使ってトレースにリンクされているため、trace_id、span_idを使って、プロファイル内の(個々のSampleではなく)Sampleのグループを参照することができます。
このようなリンクの詳細については、本OTEPの範囲外です。 正確な詳細は、opentelemetry-specificationのプロファイル関連部分で定義される予定です。
オリジナルのpprofとの互換性
提案するデータモデルは、既存のソフトウェアによって生成されたpprofファイルが新しいprotoを使ってパースできるという意味で、オリジナルのpprofと後方互換性があります。 オリジナルのpprofのすべてのフィールドが保持されているため、オリジナルのpprofファイルは引き続き新しいprotoを使ってパースでき、データが失われることはありません。
これは前方互換ではありません。 つまり、新しいprotoによって生成されたpprofファイルは既存のソフトウェアではパースできません。 これは主に、サンプル間でコールスタックが共有されていることと、ラベルの新しいフォーマット(これらの違いについては後述します)によるものです。
Protoの定義
Protoの定義は、pprofフォーマットに基づいています。
パフォーマンスプロファイリングツールの領域において、pprofのデータフォーマットは明確な業界標準としての地位を確立しています。 その進化と持続的な有用性は、多様で複雑なパフォーマンスプロファイリングのニーズに対応する上での有効性を反映しています。 大手テクノロジー企業やオープンソースプロジェクトの多くがpprofを日常的に使用しており、その汎用性と信頼性を裏付けています。
Profilerpediaのデータによれば、pprofはもっとも広く使われているフォーマットの1つです。 他のフォーマットと比較して、プロファイラー、UI、相互に変換可能なフォーマットの数がもっとも多くなっています。
オリジナルのpprofデータモデルは、OpenTelemetryの範囲内でプロファイリングデータをより効果的に管理できるように拡張が行われ、オリジナルのフォーマットが持つ制約のいくつかを克服するためのアップグレードが実施されました。
オリジナルのpprofと変更後のpprofの差分へのリンクはこちらです。 以下は、pprofとOTLPプロファイルの間の主な違いのリストです。
- サンプル間でコールスタックを共有します。
- サンプル間でラベル(現在は属性と呼ばれます)を共有します。
- OpenTelemetryの規約とメッセージ型を再利用します。
trace_idとspan_idを介した他のシグナルへのリンクのためのセマンティック規約です。- ファーストクラスのタイムスタンプサポートです。
- メタデータの付与ポイントの拡張(Sample/Location/Mapping)です。
以下に、新しいProfilesシグナルのためのprotoを示します。 これは2つの部分に分かれています。 最初の部分はOpenTelemetry固有の部分で、2番目の部分は変更後のpprof protoです。 ここでの意図は、変更後のpprof protoとオリジナルのpprof protoの比較を容易にすることです。
OpenTelemetry固有の部分:
syntax = "proto3";

package opentelemetry.proto.profiles.v1;

import "opentelemetry/proto/common/v1/common.proto";
import "opentelemetry/proto/resource/v1/resource.proto";

import "opentelemetry/proto/profiles/v1/alternatives/pprofextended/pprofextended.proto";

option csharp_namespace = "OpenTelemetry.Proto.Profiles.V1";
option java_multiple_files = true;
option java_package = "io.opentelemetry.proto.profiles.v1";
option java_outer_classname = "ProfilesProto";
option go_package = "go.opentelemetry.io/proto/otlp/profiles/v1";

//                Relationships Diagram
//
// ┌──────────────────┐                LEGEND
// │   ProfilesData   │
// └──────────────────┘            ─────▶ embedded
//   │
//   │ 1-n                         ─────▷ referenced by index
//   ▼
// ┌──────────────────┐
// │ ResourceProfiles │
// └──────────────────┘
//   │
//   │ 1-n
//   ▼
// ┌──────────────────┐
// │  ScopeProfiles   │
// └──────────────────┘
//   │
//   │ 1-n
//   ▼
// ┌──────────────────┐
// │ ProfileContainer │
// └──────────────────┘
//   │
//   │ 1-1
//   ▼
// ┌──────────────────┐
// │      Profile     │
// └──────────────────┘
//   │                                1-n
//   │ 1-n         ┌───────────────────────────────────────┐
//   ▼             │                                       ▽
// ┌──────────────────┐   1-n   ┌──────────────┐      ┌──────────┐
// │      Sample      │ ──────▷ │   KeyValue   │      │   Link   │
// └──────────────────┘         └──────────────┘      └──────────┘
//   │                    1-n       △      △
//   │ 1-n        ┌─────────────────┘      │ 1-n
//   ▽            │                        │
// ┌──────────────────┐   n-1   ┌──────────────┐
// │     Location     │ ──────▷ │   Mapping    │
// └──────────────────┘         └──────────────┘
//   │
//   │ 1-n
//   ▼
// ┌──────────────────┐
// │       Line       │
// └──────────────────┘
//   │
//   │ 1-1
//   ▽
// ┌──────────────────┐
// │     Function     │
// └──────────────────┘
//

// ProfilesData represents the profiles data that can be stored in persistent storage,
// OR can be embedded by other protocols that transfer OTLP profiles data but do not
// implement the OTLP protocol.
//
// The main difference between this message and collector protocol is that
// in this message there will not be any "control" or "metadata" specific to
// OTLP protocol.
//
// When new fields are added into this message, the OTLP request MUST be updated
// as well.
message ProfilesData {
  // An array of ResourceProfiles.
  // For data coming from a single resource this array will typically contain
  // one element. Intermediary nodes that receive data from multiple origins
  // typically batch the data before forwarding further and in that case this
  // array will contain multiple elements.
  repeated ResourceProfiles resource_profiles = 1;
}

// A collection of ScopeProfiles from a Resource.
message ResourceProfiles {
  reserved 1000;

  // The resource for the profiles in this message.
  // If this field is not set then no resource info is known.
  opentelemetry.proto.resource.v1.Resource resource = 1;

  // A list of ScopeProfiles that originate from a resource.
  repeated ScopeProfiles scope_profiles = 2;

  // This schema_url applies to the data in the "resource" field. It does not apply
  // to the data in the "scope_profiles" field which have their own schema_url field.
  string schema_url = 3;
}

// A collection of Profiles produced by an InstrumentationScope.
message ScopeProfiles {
  // The instrumentation scope information for the profiles in this message.
  // Semantically when InstrumentationScope isn't set, it is equivalent with
  // an empty instrumentation scope name (unknown).
  opentelemetry.proto.common.v1.InstrumentationScope scope = 1;

  // A list of ProfileContainers that originate from an instrumentation scope.
  repeated ProfileContainer profiles = 2;

  // This schema_url applies to all profiles and profile events in the "profiles" field.
  string schema_url = 3;
}

// A ProfileContainer represents a single profile. It wraps pprof profile with OpenTelemetry specific metadata.
message ProfileContainer {
  // A globally unique identifier for a profile. The ID is a 16-byte array. An ID with
  // all zeroes is considered invalid.
  //
  // This field is required.
  bytes profile_id = 1;

  // start_time_unix_nano is the start time of the profile.
  // Value is UNIX Epoch time in nanoseconds since 00:00:00 UTC on 1 January 1970.
  //
  // This field is semantically required and it is expected that end_time >= start_time.
  fixed64 start_time_unix_nano = 2;

  // end_time_unix_nano is the end time of the profile.
  // Value is UNIX Epoch time in nanoseconds since 00:00:00 UTC on 1 January 1970.
  //
  // This field is semantically required and it is expected that end_time >= start_time.
  fixed64 end_time_unix_nano = 3;

  // attributes is a collection of key/value pairs. Note, global attributes
  // like server name can be set using the resource API. Examples of attributes:
  //
  //     "/http/user_agent": "Mozilla/5.0 (Macintosh; Intel Mac OS X 10_14_2) AppleWebKit/537.36 (KHTML, like Gecko) Chrome/71.0.3578.98 Safari/537.36"
  //     "/http/server_latency": 300
  //     "abc.com/myattribute": true
  //     "abc.com/score": 10.239
  //
  // The OpenTelemetry API specification further restricts the allowed value types:
  // https://github.com/open-telemetry/opentelemetry-specification/blob/main/specification/common/README.md#attribute
  // Attribute keys MUST be unique (it is not allowed to have more than one
  // attribute with the same key).
  repeated opentelemetry.proto.common.v1.KeyValue attributes = 4;

  // dropped_attributes_count is the number of attributes that were discarded. Attributes
  // can be discarded because their keys are too long or because there are too many
  // attributes. If this value is 0, then no attributes were dropped.
  uint32 dropped_attributes_count = 5;

  // Specifies format of the original payload. Common values are defined in semantic conventions. [required if original_payload is present]
  string original_payload_format = 6;

  // Original payload can be stored in this field. This can be useful for users who want to get the original payload.
  // Formats such as JFR are highly extensible and can contain more information than what is defined in this spec.
  // Inclusion of original payload should be configurable by the user. Default behavior should be to not include the original payload.
  // If the original payload is in pprof format, it SHOULD not be included in this field.
  // The field is optional, however if it is present `profile` MUST be present and contain the same profiling information.
  bytes original_payload = 7;

  // This is a reference to a pprof profile. Required, even when original_payload is present.
  opentelemetry.proto.profiles.v1.alternatives.pprofextended.Profile profile = 8;
}
変更後のpprof:
// Profile is a common stacktrace profile format.
//
// Measurements represented with this format should follow the
// following conventions:
//
// - Consumers should treat unset optional fields as if they had been
//   set with their default value.
//
// - When possible, measurements should be stored in "unsampled" form
//   that is most useful to humans.  There should be enough
//   information present to determine the original sampled values.
//
// - On-disk, the serialized proto must be gzip-compressed.
//
// - The profile is represented as a set of samples, where each sample
//   references a sequence of locations, and where each location belongs
//   to a mapping.
// - There is a N->1 relationship from sample.location_id entries to
//   locations. For every sample.location_id entry there must be a
//   unique Location with that index.
// - There is an optional N->1 relationship from locations to
//   mappings. For every nonzero Location.mapping_id there must be a
//   unique Mapping with that index.

syntax = "proto3";

package opentelemetry.proto.profiles.v1.alternatives.pprofextended;

import "opentelemetry/proto/common/v1/common.proto";

option csharp_namespace = "OpenTelemetry.Proto.Profiles.V1.Alternatives.PprofExtended";
option go_package = "go.opentelemetry.io/proto/otlp/profiles/v1/alternatives/pprofextended";

// Represents a complete profile, including sample types, samples,
// mappings to binaries, locations, functions, string table, and additional metadata.
message Profile {
  // A description of the samples associated with each Sample.value.
  // For a cpu profile this might be:
  //   [["cpu","nanoseconds"]] or [["wall","seconds"]] or [["syscall","count"]]
  // For a heap profile, this might be:
  //   [["allocations","count"], ["space","bytes"]],
  // If one of the values represents the number of events represented
  // by the sample, by convention it should be at index 0 and use
  // sample_type.unit == "count".
  repeated ValueType sample_type = 1;
  // The set of samples recorded in this profile.
  repeated Sample sample = 2;
  // Mapping from address ranges to the image/binary/library mapped
  // into that address range.  mapping[0] will be the main binary.
  repeated Mapping mapping = 3;
  // Locations referenced by samples via location_indices.
  repeated Location location = 4;
  // Array of locations referenced by samples.
  repeated int64 location_indices = 15;
  // Functions referenced by locations.
  repeated Function function = 5;
  // Lookup table for attributes.
  repeated opentelemetry.proto.common.v1.KeyValue attribute_table = 16;
  // Represents a mapping between Attribute Keys and Units.
  repeated AttributeUnit attribute_units = 17;
  // Lookup table for links.
  repeated Link link_table = 18;
  // A common table for strings referenced by various messages.
  // string_table[0] must always be "".
  repeated string string_table = 6;
  // frames with Function.function_name fully matching the following
  // regexp will be dropped from the samples, along with their successors.
  int64 drop_frames = 7;   // Index into string table.
  // frames with Function.function_name fully matching the following
  // regexp will be kept, even if it matches drop_frames.
  int64 keep_frames = 8;  // Index into string table.

  // The following fields are informational, do not affect
  // interpretation of results.

  // Time of collection (UTC) represented as nanoseconds past the epoch.
  int64 time_nanos = 9;
  // Duration of the profile, if a duration makes sense.
  int64 duration_nanos = 10;
  // The kind of events between sampled occurrences.
  // e.g [ "cpu","cycles" ] or [ "heap","bytes" ]
  ValueType period_type = 11;
  // The number of events between sampled occurrences.
  int64 period = 12;
  // Free-form text associated with the profile. The text is displayed as is
  // to the user by the tools that read profiles (e.g. by pprof). This field
  // should not be used to store any machine-readable information, it is only
  // for human-friendly content. The profile must stay functional if this field
  // is cleaned.
  repeated int64 comment = 13; // Indexes into string table.
  // Index into the string table of the type of the preferred sample
  // value. If unset, clients should default to the last sample value.
  int64 default_sample_type = 14;
}

// Represents a mapping between Attribute Keys and Units.
message AttributeUnit {
  // Index into string table.
  int64 attribute_key = 1;
  // Index into string table.
  int64 unit = 2;
}

// A pointer from a profile Sample to a trace Span.
// Connects a profile sample to a trace span, identified by unique trace and span IDs.
message Link {
  // A unique identifier of a trace that this linked span is part of. The ID is a
  // 16-byte array.
  bytes trace_id = 1;

  // A unique identifier for the linked span. The ID is an 8-byte array.
  bytes span_id = 2;
}

// Specifies the method of aggregating metric values, either DELTA (change since last report)
// or CUMULATIVE (total since a fixed start time).
enum AggregationTemporality {
  /* UNSPECIFIED is the default AggregationTemporality, it MUST not be used. */
  AGGREGATION_TEMPORALITY_UNSPECIFIED = 0;

  /** DELTA is an AggregationTemporality for a profiler which reports
  changes since last report time. Successive metrics contain aggregation of
  values from continuous and non-overlapping intervals.

  The values for a DELTA metric are based only on the time interval
  associated with one measurement cycle. There is no dependency on
  previous measurements like is the case for CUMULATIVE metrics.

  For example, consider a system measuring the number of requests that
  it receives and reports the sum of these requests every second as a
  DELTA metric:

  1. The system starts receiving at time=t_0.
  2. A request is received, the system measures 1 request.
  3. A request is received, the system measures 1 request.
  4. A request is received, the system measures 1 request.
  5. The 1 second collection cycle ends. A metric is exported for the
      number of requests received over the interval of time t_0 to
      t_0+1 with a value of 3.
  6. A request is received, the system measures 1 request.
  7. A request is received, the system measures 1 request.
  8. The 1 second collection cycle ends. A metric is exported for the
      number of requests received over the interval of time t_0+1 to
      t_0+2 with a value of 2. */
  AGGREGATION_TEMPORALITY_DELTA = 1;

  /** CUMULATIVE is an AggregationTemporality for a profiler which
  reports changes since a fixed start time. This means that current values
  of a CUMULATIVE metric depend on all previous measurements since the
  start time. Because of this, the sender is required to retain this state
  in some form. If this state is lost or invalidated, the CUMULATIVE metric
  values MUST be reset and a new fixed start time following the last
  reported measurement time sent MUST be used.

  For example, consider a system measuring the number of requests that
  it receives and reports the sum of these requests every second as a
  CUMULATIVE metric:

  1. The system starts receiving at time=t_0.
  2. A request is received, the system measures 1 request.
  3. A request is received, the system measures 1 request.
  4. A request is received, the system measures 1 request.
  5. The 1 second collection cycle ends. A metric is exported for the
      number of requests received over the interval of time t_0 to
      t_0+1 with a value of 3.
  6. A request is received, the system measures 1 request.
  7. A request is received, the system measures 1 request.
  8. The 1 second collection cycle ends. A metric is exported for the
      number of requests received over the interval of time t_0 to
      t_0+2 with a value of 5.
  9. The system experiences a fault and loses state.
  10. The system recovers and resumes receiving at time=t_1.
  11. A request is received, the system measures 1 request.
  12. The 1 second collection cycle ends. A metric is exported for the
      number of requests received over the interval of time t_1 to
      t_0+1 with a value of 1.

  Note: Even though, when reporting changes since last report time, using
  CUMULATIVE is valid, it is not recommended. */
  AGGREGATION_TEMPORALITY_CUMULATIVE = 2;
}

// ValueType describes the type and units of a value, with an optional aggregation temporality.
message ValueType {
  int64 type = 1; // Index into string table.
  int64 unit = 2; // Index into string table.

  AggregationTemporality aggregation_temporality = 3;
}

// Each Sample records values encountered in some program
// context. The program context is typically a stack trace, perhaps
// augmented with auxiliary information like the thread-id, some
// indicator of a higher level request being handled etc.
message Sample {
  // The indexes recorded here correspond to locations in Profile.location.
  // The leaf is at location_index[0]. [deprecated, superseded by locations_start_index / locations_length]
  repeated uint64 location_index = 1;
  // locations_start_index along with locations_length refers to to a slice of locations in Profile.location.
  // Supersedes location_index.
  uint64 locations_start_index = 7;
  // locations_length along with locations_start_index refers to a slice of locations in Profile.location.
  // Supersedes location_index.
  uint64 locations_length = 8;
  // A 128bit id that uniquely identifies this stacktrace, globally. Index into string table. [optional]
  uint32 stacktrace_id_index = 9;
  // The type and unit of each value is defined by the corresponding
  // entry in Profile.sample_type. All samples must have the same
  // number of values, the same as the length of Profile.sample_type.
  // When aggregating multiple samples into a single sample, the
  // result has a list of values that is the element-wise sum of the
  // lists of the originals.
  repeated int64 value = 2;
  // label includes additional context for this sample. It can include
  // things like a thread id, allocation size, etc.
  //
  // NOTE: While possible, having multiple values for the same label key is
  // strongly discouraged and should never be used. Most tools (e.g. pprof) do
  // not have good (or any) support for multi-value labels. And an even more
  // discouraged case is having a string label and a numeric label of the same
  // name on a sample.  Again, possible to express, but should not be used.
  // [deprecated, superseded by attributes]
  repeated Label label = 3;
  // References to attributes in Profile.attribute_table. [optional]
  repeated uint64 attributes = 10;

  // Reference to link in Profile.link_table. [optional]
  uint64 link = 12;

  // Timestamps associated with Sample represented in ms. These timestamps are expected
  // to fall within the Profile's time range. [optional]
  repeated uint64 timestamps = 13;
}

// Provides additional context for a sample,
// such as thread ID or allocation size, with optional units. [deprecated]
message Label {
  int64 key = 1;   // Index into string table

  // At most one of the following must be present
  int64 str = 2;   // Index into string table
  int64 num = 3;

  // Should only be present when num is present.
  // Specifies the units of num.
  // Use arbitrary string (for example, "requests") as a custom count unit.
  // If no unit is specified, consumer may apply heuristic to deduce the unit.
  // Consumers may also  interpret units like "bytes" and "kilobytes" as memory
  // units and units like "seconds" and "nanoseconds" as time units,
  // and apply appropriate unit conversions to these.
  int64 num_unit = 4;  // Index into string table
}

// Indicates the semantics of the build_id field.
enum BuildIdKind {
  // Linker-generated build ID, stored in the ELF binary notes.
  BUILD_ID_LINKER = 0;
  // Build ID based on the content hash of the binary. Currently no particular
  // hashing approach is standardized, so a given producer needs to define it
  // themselves and thus unlike BUILD_ID_LINKER this kind of hash is producer-specific.
  // We may choose to provide a standardized stable hash recommendation later.
  BUILD_ID_BINARY_HASH = 1;
}

// Describes the mapping of a binary in memory, including its address range,
// file offset, and metadata like build ID
message Mapping {
  // Unique nonzero id for the mapping. [deprecated]
  uint64 id = 1;
  // Address at which the binary (or DLL) is loaded into memory.
  uint64 memory_start = 2;
  // The limit of the address range occupied by this mapping.
  uint64 memory_limit = 3;
  // Offset in the binary that corresponds to the first mapped address.
  uint64 file_offset = 4;
  // The object this entry is loaded from.  This can be a filename on
  // disk for the main binary and shared libraries, or virtual
  // abstractions like "[vdso]".
  int64 filename = 5;  // Index into string table
  // A string that uniquely identifies a particular program version
  // with high probability. E.g., for binaries generated by GNU tools,
  // it could be the contents of the .note.gnu.build-id field.
  int64 build_id = 6;  // Index into string table
  // Specifies the kind of build id. See BuildIdKind enum for more details [optional]
  BuildIdKind build_id_kind = 11;
  // References to attributes in Profile.attribute_table. [optional]
  repeated uint64 attributes = 12;
  // The following fields indicate the resolution of symbolic info.
  bool has_functions = 7;
  bool has_filenames = 8;
  bool has_line_numbers = 9;
  bool has_inline_frames = 10;
}

// Describes function and line table debug information.
message Location {
  // Unique nonzero id for the location.  A profile could use
  // instruction addresses or any integer sequence as ids. [deprecated]
  uint64 id = 1;
  // The index of the corresponding profile.Mapping for this location.
  // It can be unset if the mapping is unknown or not applicable for
  // this profile type.
  uint64 mapping_index = 2;
  // The instruction address for this location, if available.  It
  // should be within [Mapping.memory_start...Mapping.memory_limit]
  // for the corresponding mapping. A non-leaf address may be in the
  // middle of a call instruction. It is up to display tools to find
  // the beginning of the instruction if necessary.
  uint64 address = 3;
  // Multiple line indicates this location has inlined functions,
  // where the last entry represents the caller into which the
  // preceding entries were inlined.
  //
  // E.g., if memcpy() is inlined into printf:
  //    line[0].function_name == "memcpy"
  //    line[1].function_name == "printf"
  repeated Line line = 4;
  // Provides an indication that multiple symbols map to this location's
  // address, for example due to identical code folding by the linker. In that
  // case the line information above represents one of the multiple
  // symbols. This field must be recomputed when the symbolization state of the
  // profile changes.
  bool is_folded = 5;

  // Type of frame (e.g. kernel, native, python, hotspot, php). Index into string table.
  uint32 type_index = 6;

  // References to attributes in Profile.attribute_table. [optional]
  repeated uint64 attributes = 7;
}

// Details a specific line in a source code, linked to a function.
message Line {
  // The index of the corresponding profile.Function for this line.
  uint64 function_index = 1;
  // Line number in source code.
  int64 line = 2;
  // Column number in source code.
  int64 column = 3;
}

// Describes a function, including its human-readable name, system name,
// source file, and starting line number in the source.
message Function {
  // Unique nonzero id for the function. [deprecated]
  uint64 id = 1;
  // Name of the function, in human-readable form if available.
  int64 name = 2; // Index into string table
  // Name of the function, as identified by the system.
  // For instance, it can be a C++ mangled name.
  int64 system_name = 3; // Index into string table
  // Source file containing the function.
  int64 filename = 4; // Index into string table
  // Line number in source file.
  int64 start_line = 5;
}
メッセージの説明
以下は、プロファイリングデータを表現するために使われるprotobufメッセージの詳細な説明です。
メッセージ ProfilesData
ProfilesDataは、永続ストレージに保存できるプロファイルデータを表現します。 また、OTLPプロファイルデータを転送するがOTLPプロトコルを実装しない他のプロトコルによって埋め込まれることもできます。 このメッセージがコレクタープロトコルと異なる主な点は、このメッセージにはOTLPプロトコル固有の「コントロール」や「メタデータ」が含まれないことです。 このメッセージに新しいフィールドが追加された場合、OTLPリクエストも更新されなければなりません(MUST)。
メッセージ ResourceProfiles
Resourceに由来するScopeProfilesの集合です。
フィールドの説明
フィールド resource
このメッセージ内のプロファイルに対応するリソースです。 このフィールドが設定されていない場合、リソース情報は不明であることを表します。
フィールド scope_profiles
リソースに由来するScopeProfilesのリストです。
フィールド schema_url
このschema_urlは、「resource」フィールドのデータに適用されます。 これは「scope_profiles」フィールドのデータには適用されません。 scope_profilesフィールドは自身のschema_urlフィールドを持ちます。
メッセージ ScopeProfiles
InstrumentationScopeによって生成されたProfilesの集合です。
フィールドの説明
フィールド scope
このメッセージ内のプロファイルに対応する計装スコープの情報です。 InstrumentationScopeが設定されていない場合、意味的には空の計装スコープ名(不明)と同等です。
フィールド profiles
計装スコープに由来するProfileContainerのリストです。
フィールド schema_url
このschema_urlは、「profiles」フィールド内のすべてのプロファイルとプロファイルイベントに適用されます。
メッセージ ProfileContainer
ProfileContainerは1つのプロファイルを表現します。 pprofプロファイルをOpenTelemetry固有のメタデータでラップします。
フィールドの説明
フィールド profile_id
プロファイルのグローバルに一意な識別子です。 IDは16バイトの配列です。 すべてゼロのIDは無効とみなされます。 このフィールドは必須です。
フィールド start_time_unix_nano
start_time_unix_nanoはプロファイルの開始時刻です。 値は1970年1月1日00:00:00 UTC からのナノ秒単位のUNIXエポック時刻です。 このフィールドは意味的に必須であり、end_time >= start_timeであることが期待されます。
フィールド end_time_unix_nano
end_time_unix_nanoはプロファイルの終了時刻です。 値は1970年1月1日00:00:00 UTC からのナノ秒単位のUNIXエポック時刻です。 このフィールドは意味的に必須であり、end_time >= start_timeであることが期待されます。
フィールド attributes
attributesはキーと値のペアの集合です。 サーバー名のようなグローバルな属性はresource APIを使って設定できることに注意してください。
フィールド dropped_attributes_count
dropped_attributes_countは破棄された属性の数です。 属性は、キーが長すぎる場合や属性の数が多すぎる場合に破棄されることがあります。 この値が0の場合、属性は破棄されていません。
フィールド original_payload_format
元のペイロードのフォーマットを指定します。 一般的な値はセマンティック規約で定義されます。(original_payloadが存在する場合は必須)
フィールド original_payload
このフィールドには元のペイロードを格納できます。
これは、元のペイロードを取得したいユーザーにとって有用です。
JFRのようなフォーマットは高い拡張性を持ち、本仕様で定義されている以上の情報を含むことがあります。
元のペイロードを含めるかどうかは、ユーザーが設定できるようにすべきです。
デフォルトの動作としては元のペイロードを含めないようにすべきです。
元のペイロードがpprof形式である場合、このフィールドには含めるべきではありません(SHOULD not)。
このフィールドは任意ですが、存在する場合はprofileも存在し、同じプロファイリング情報を含んでいなければなりません(MUST)。
フィールド profile
これはpprofプロファイルへの参照です。 original_payloadが存在する場合でも必須です。
メッセージ Profile
Profileは共通のスタックトレースプロファイルフォーマットです。 このフォーマットで表現される計測値は、以下の規約に従うべきです。
- コンシューマーは、未設定のオプションフィールドを、デフォルト値が設定されているものとして扱うべきです。
- 可能な場合、計測値は人間にとってもっとも有用な「アンサンプル」形式で保存すべきです。 元のサンプリングされた値を判別できるだけの十分な情報が存在すべきです。
- ディスク上では、シリアライズされたprotoはgzip圧縮されていなければなりません(must)。
- プロファイルは一連のサンプルの集合として表現されます。各サンプルは一連のロケーションを参照し、各ロケーションはマッピングに属します。
- sample.location_idのエントリからロケーションへはN対1の関係があります。 sample.location_idの各エントリに対して、そのインデックスを持つ一意なLocationが存在しなければなりません。
- ロケーションからマッピングへは任意のN対1の関係があります。 0以外のLocation.mapping_idごとに、そのインデックスを持つ一意なMappingが存在しなければなりません。
サンプルタイプ、サンプル、バイナリへのマッピング、ロケーション、関数、文字列テーブル、および追加のメタデータを含む、完全なプロファイルを表現します。
フィールドの説明
フィールド sample_type
各Sample.valueに対応するサンプルの説明です。 CPUプロファイルの場合、これは次のようになります。 [[“CPU”,“nanoseconds”]] または [[“wall”,“seconds”]] または [[“syscall”,“count”]] ヒーププロファイルの場合、これは次のようになります。 [[“allocations”,“count”], [“space”,“bytes”]]、 いずれかの値がサンプルによって表されるイベント数を表す場合、慣例としてインデックス0に配置し、sample_type.unit == “count"を使うべきです。
フィールド sample
このプロファイルに記録されたサンプルの集合です。
フィールド mapping
アドレス範囲から、そのアドレス範囲にマッピングされたイメージ/バイナリ/ライブラリへのマッピングです。 mapping[0]はメインバイナリになります。
フィールド location
location_indicesを介してサンプルから参照されるロケーションです。
フィールド location_indices
サンプルから参照されるロケーションの配列です。
フィールド function
ロケーションから参照される関数です。
フィールド attribute_table
属性のルックアップテーブルです。
フィールド attribute_units
Attribute KeyとUnitの間のマッピングを表現します。
フィールド link_table
リンクのルックアップテーブルです。
フィールド string_table
さまざまなメッセージから参照される文字列のための共通テーブルです。 string_table[0]は常に"“でなければなりません(must)。
フィールド drop_frames
Function.function_nameが以下の正規表現に完全一致するフレームは、後続のフレームとともにサンプルから除外されます。
フィールド keep_frames
文字列テーブルへのインデックスです。 Function.function_nameが以下の正規表現に完全一致するフレームは、drop_framesに一致していても保持されます。
フィールド time_nanos
文字列テーブルへのインデックスです。 以下のフィールドは情報提供のためのものであり、結果の解釈には影響しません。 収集時刻(UTC)をエポックからのナノ秒で表したものです。
フィールド duration_nanos
意味がある場合の、プロファイルの継続時間です。
フィールド period_type
サンプリングされたイベント間のイベントの種類です。 例: [ “CPU”,“cycles” ] または [ “heap”,“bytes” ]
フィールド period
サンプリングされたイベント間のイベント数です。
フィールド comment
プロファイルに関連付けられた自由形式のテキストです。 このテキストは、プロファイルを読むツール(pprofなど)によってユーザーにそのまま表示されます。 このフィールドは、機械可読な情報を格納するために使うべきではなく、人間にとって読みやすいコンテンツのためだけに使うべきです。 このフィールドがクリアされてもプロファイルは機能し続けなければなりません(must)。
フィールド default_sample_type
文字列テーブルへのインデックスです。 優先されるサンプル値のタイプを示す、文字列テーブルへのインデックスです。 未設定の場合、クライアントは最後のサンプル値をデフォルトとして使うべきです。
メッセージ ValueType
ValueTypeは、任意の集約時間的性質(aggregation temporality)を伴う、値の型と単位を表します。
フィールドの説明
フィールド unit
文字列テーブルへのインデックスです。
フィールド aggregation_temporality
文字列テーブルへのインデックスです。
メッセージ Sample
各Sampleは、あるプログラムのコンテキストにおいて観測された値を記録します。 このプログラムのコンテキストは、典型的にはスタックトレースであり、スレッドIDやより高いレベルのリクエストが処理されていることを示す情報などの補助情報が付加されることもあります。
フィールドの説明
フィールド location_index
ここに記録されたインデックスは、Profile.location内のロケーションに対応します。 リーフはlocation_index[0]にあります。(非推奨、locations_start_index / locations_lengthに置き換えられました)
フィールド locations_start_index
locations_start_indexは、locations_lengthとともに、Profile.location内のロケーションのスライスを参照します。 location_indexを置き換えるものです。
フィールド locations_length
locations_lengthは、locations_start_indexとともに、Profile.location内のロケーションのスライスを参照します。 location_indexを置き換えるものです。
フィールド stacktrace_id_index
このスタックトレースをグローバルに一意に識別する128ビットのIDです。 文字列テーブルへのインデックスです。(任意)
フィールド value
各値の型と単位は、Profile.sample_type内の対応するエントリによって定義されます。 すべてのサンプルは、Profile.sample_typeの長さと同じ数の値を持たなければなりません(must)。 複数のサンプルを1つのサンプルに集約する場合、結果は元のリストの要素ごとの和からなるリストになります。
フィールド label
labelはこのサンプルに関する追加のコンテキストを含みます。 スレッドID、割り当てサイズなどを含めることができます。 注記: 可能ではありますが、同じラベルキーに対して複数の値を持つことは強く推奨されず、決して使うべきではありません(should never be used)。 ほとんどのツール(pprofなど)は、複数値ラベルに対する十分な(あるいはまったくの)サポートを持ちません。 さらに推奨されないケースとして、同じサンプルに同じ名前の文字列ラベルと数値ラベルの両方を持たせることが挙げられます。 繰り返しになりますが、表現することは可能ですが使うべきではありません。 (非推奨、attributesに置き換えられました)
フィールド attributes
Profile.attribute_table内の属性への参照です。(任意)
フィールド link
Profile.link_table内のリンクへの参照です。(任意)
フィールド timestamps
ミリ秒で表された、Sampleに関連付けられたタイムスタンプです。 これらのタイムスタンプは、Profileの時間範囲内に収まることが期待されます。(任意)
メッセージ AttributeUnit
Attribute KeyとUnitの間のマッピングを表現します。
フィールドの説明
フィールド attribute_key
文字列テーブルへのインデックスです。
フィールド unit
文字列テーブルへのインデックスです。
メッセージ Link
プロファイルのSampleからトレースのSpanへのポインタです。 プロファイルのサンプルを、一意なトレースIDとスパンIDによって識別されるトレーススパンに接続します。
フィールドの説明
フィールド trace_id
このリンクされたスパンが属するトレースの一意な識別子です。 IDは16バイトの配列です。
フィールド span_id
リンクされたスパンの一意な識別子です。 IDは8バイトの配列です。
メッセージ Location
関数と行テーブルのデバッグ情報を記述します。
フィールドの説明
フィールド id
ロケーションに対する一意な非ゼロのIDです。 プロファイルは命令アドレスや任意の整数列をIDとして使うことができます。(非推奨)
フィールド mapping_index
このロケーションに対応するprofile.Mappingのインデックスです。 マッピングが不明であるか、このプロファイルタイプに適用できない場合は未設定にできます。
フィールド address
利用可能な場合の、このロケーションに対応する命令アドレスです。 対応するマッピングの[Mapping.memory_start…Mapping.memory_limit]の範囲内にあるべきです。 リーフでないアドレスは、呼び出し命令の途中を指している場合があります。 必要であれば、命令の先頭を見つけるのは表示ツール側の責務です。
フィールド line
複数のlineは、このロケーションがインライン化された関数を持つことを示します。 最後のエントリは、直前のエントリがインライン化された先の呼び出し元を表します。 例えば、memcpy()がprintfにインライン化されている場合: line[0].function_name == “memcpy” line[1].function_name == “printf”
フィールド is_folded
たとえばリンカによる同一コードの畳み込み(identical code folding)などにより、複数のシンボルがこのロケーションのアドレスにマッピングされていることを示します。 その場合、上記の行情報は複数のシンボルのうちの1つを表します。 プロファイルのシンボリケーション状態が変化した場合、このフィールドは再計算されなければなりません(must)。
フィールド type_index
フレームの種類(カーネル、ネイティブ、Python、hotspot、PHPなど)です。 文字列テーブルへのインデックスです。
フィールド attributes
Profile.attribute_table内の属性への参照です。(任意)
メッセージ Line
関数にリンクされた、ソースコード内の特定の行を詳細に記述します。
フィールドの説明
フィールド function_index
この行に対応するprofile.Functionのインデックスです。
フィールド line
ソースコード内の行番号です。
フィールド column
ソースコード内の列番号です。
メッセージ Mapping
アドレス範囲、ファイルオフセット、ビルドIDなどのメタデータを含む、メモリ上のバイナリのマッピングを記述します。
フィールドの説明
フィールド id
マッピングに対する一意な非ゼロのIDです。(非推奨)
フィールド memory_start
バイナリ(またはDLL)がメモリにロードされるアドレスです。
フィールド memory_limit
このマッピングが占めるアドレス範囲の上限です。
フィールド file_offset
最初にマッピングされたアドレスに対応する、バイナリ内のオフセットです。
フィールド filename
このエントリがロードされる元となったオブジェクトです。 メインバイナリや共有ライブラリの場合、ディスク上のファイル名になり得ますし、「[vDSO]」のような仮想的な抽象表現になることもあります。
フィールド build_id
文字列テーブルへのインデックスです。 特定のプログラムのバージョンを高い確率で一意に識別する文字列です。 たとえば、GNUツールによって生成されたバイナリの場合、.note.gnu.build-idフィールドの内容になり得ます。
フィールド build_id_kind
文字列テーブルへのインデックスです。 ビルドIDの種類を指定します。 詳細はBuildIdKind列挙型を参照してください。(任意)
フィールド attributes
Profile.attribute_table内の属性への参照です。(任意)
フィールド has_functions
以下のフィールドは、シンボル情報の解決状況を示します。
メッセージ Function
人間可読な名前、システム名、ソースファイル、ソース内の開始行番号を含む、関数を記述します。
フィールドの説明
フィールド id
関数に対する一意な非ゼロのIDです。(非推奨)
フィールド name
利用可能な場合の、人間可読な形式での関数名です。
フィールド system_name
文字列テーブルへのインデックスです。 システムによって識別される関数名です。 たとえば、C++のマングルされた名前になり得ます。
フィールド filename
文字列テーブルへのインデックスです。 関数を含むソースファイルです。
フィールド start_line
文字列テーブルへのインデックスです。 ソースファイル内の行番号です。
ペイロードの例
シンプルな例
次の例が、変更された折りたたみ形式(folded format)で提示されているとします。
foo;bar;baz 100 region=us,trace_id=0x01020304010203040102030401020304,span_id=0x9999999999999999 1687841528000000
foo;bar 200 region=us
これは2つのサンプルを表します。
- スタックトレース
foo;bar;bazに対して、値100、属性region=us、トレース0x01020304010203040102030401020304とスパン0x9999999999999999へのリンク、タイムスタンプ1687841528000000を持つもの - スタックトレース
foo;barに対して、値200、属性region=us、リンクなし、タイムスタンプなしを持つもの
結果として得られるOTLP形式のプロファイルは(可読性のためYAML形式に変換すると)次のようになります。
resource_profiles:
  - resource:
      attributes: null
    schema_url: todo
    scope_profiles:
      - profiles:
          - profile_id: 0x0102030405060708090a0b0c0d0e0f10
            start_time_unix_nano: 1687841520000000
            end_time_unix_nano: 1687841530000000
            profile:
              sample_type:
                type: 4
                unit: 5
                aggregation_temporality: 1
              attribute_table:
                - key: trace_id
                  value:
                    Value:
                      bytes_value: 0x01020304010203040102030401020304
                - key: span_id
                  value:
                    Value:
                      bytes_value: 0x9999999999999999
                - key: region
                  value:
                    Value:
                      string_value: us
              function:
                - name: 1
                - name: 2
                - name: 3
              location:
                - line:
                    - function_index: 0
                - line:
                    - function_index: 1
                - line:
                    - function_index: 2
              location_indices:
                - 0
                - 1
                - 2
              sample:
                - locations_start_index: 0
                  locations_length: 3
                  timestamps:
                    - 1687841528000000
                  value:
                    - 100
                - locations_start_index: 0
                  locations_length: 2
                  value:
                    - 200
              string_table:
                - ""
                - foo
                - bar
                - baz
                - cpu
                - samples
他のシグナルと比較した際の注目すべき違い
プロファイルシグナルに関連する高いパフォーマンス要件のため、プロファイルシグナルと他のシグナルの間には、いくつかの注目すべき違いがあります。
メッセージ間の関係
メッセージ間の関係を表現する主な方法は2つあります。
- あるメッセージを別のメッセージに埋め込む方法(標準的なprotobufの方法)
- インデックスによってメッセージを参照する方法(pprofでの方法と類似)
プロファイリングシグナルが他の多くのシグナルと異なる点は、重複が多く発生するメッセージ間の関係を表現するために、参照によるテクニックを多用していることです。 これにより、結果として得られるprotobufペイロードのサイズと、そのようなペイロードをパースするために割り当てる必要があるオブジェクトの数を削減できます。
以下の例は、2つのアプローチの概念的な違いを示しています。 この例は、わかりやすさのために簡略化されており、可読性のためYAML形式で示されていることに注意してください。
# denormalized
samples:
- stacktrace:
  - foo
  - bar
  value: 100
  attribute_set:
    endpoint: "/v1/users"
- stacktrace:
  - foo
  - bar
  - baz
  value: 200
  attribute_set:
    endpoint: "/v1/users"

# normalized
attribute_sets:
- endpoint: "/v1/users"
samples:
- stacktrace:
  - foo
  - bar
  value: 100
  attribute_set_index: 0
- stacktrace:
  - foo
  - bar
  - baz
  value: 200
  attribute_set_index: 0
説明: 複数のサンプルが同じ属性を持っているため、それらを別のテーブルに格納し、インデックスによって参照することができます。 これにより、結果として得られるprotobufペイロードのサイズと、そのようなペイロードをパースするために割り当てる必要があるオブジェクトの数を削減できます。
ベンチマークによると、このアプローチはCPU使用率、メモリ消費量、および結果として得られるprotobufペイロードのサイズの点で、著しく効率的であることが示されています。 詳細は先行技術と代替技術を参照してください。
サンプルとロケーション間の関係
SampleとLocationの間の関係は、上述の参照テクニックを使用しています。 しかし、結果として得られるprotobufペイロードのサイズと、そのようなペイロードをパースするために割り当てる必要があるオブジェクトの数をさらに削減するために、追加の最適化テクニックが使われています。 このテクニックは、多くのサンプルが同じロケーションを共有しているという事実に基づいています。
次の例が、折りたたみ形式(folded format)で提示されているとします。
foo;bar;baz 100
abc;def 200
foo;bar 300
これは3つのサンプルを表します。
- スタックトレース
foo;bar;bazに対して値100を持つもの。 - スタックトレース
abc;defに対して値200を持つもの。 - スタックトレース
foo;barに対して値300を持つもの。ロケーションのうち2つが最初のサンプルと共有されていることに注意してください。
ロケーションを別のテーブルに格納し、そのテーブル内のstart_index+lengthを参照することで、結果として得られるprotobufペイロードのサイズと、そのようなペイロードをパースするために割り当てる必要があるオブジェクトの数を削減できます。 このアプローチでは、多くのサンプルが同じロケーションを共有しているという事実も活用できます。 以下は、結果として得られるprotobufペイロードの表現です(可読性のためYAML形式で示しています)。
sample:
  - locations_start_index: 0
    locations_length: 3
    value:
      - 100
  - locations_start_index: 3
    locations_length: 2
    value:
      - 200
  - locations_start_index: 0
    locations_length: 2
    value:
      - 300
location_indices:
  - 0 # foo
  - 1 # bar
  - 2 # baz
  - 3 # abc
  - 4 # def
location:
  - line:
      - function_index: 0 # foo
  - line:
      - function_index: 1 # bar
  - line:
      - function_index: 2 # baz
  - line:
      - function_index: 3 # abc
  - line:
      - function_index: 4 # def
function:
  - name: 1 # foo
  - name: 2 # bar
  - name: 3 # baz
  - name: 4 # abc
  - name: 5 # def
string_table:
  - ""
  - foo
  - bar
  - baz
  - abc
  - def
ベンチマークによると、このアプローチはCPU使用率、メモリ消費量、および結果として得られるprotobufペイロードのサイズの点で、著しく効率的であることが示されています。 詳細は先行技術と代替技術を参照してください。
トレードオフと緩和策
もっとも大きなトレードオフは、フォーマットのパフォーマンス特性とそのシンプルさとの間で行われました。 パフォーマンス特性を重視した結果、認知的により複雑なフォーマットになりました。
著者らは、以下の理由からこの複雑さは正当化されると考えています。
- 設計目標セクションで示したとおり、プロファイリングシグナルにとってフォーマットのパフォーマンス特性は非常に重要です。
- このフォーマットはエンドユーザーが直接使用することを意図しておらず、複雑さを扱うことに慣れており、またそれが期待されているプロファイリングシステムの開発者によって使用されることを想定しています。 これは既存の他のフォーマットより複雑というわけではありません。
より理解しやすい代替フォーマットも検討されましたが、CPU使用率、メモリ消費量、結果として得られるprotobufペイロードのサイズの点で、これほど効率的ではありませんでした。 詳細は次章の先行技術と代替技術を参照してください。
先行技術と代替技術
このセクションでは、このデータモデルを設計する過程で検討された、他の既存の一般的なフォーマットと代替の表現方法について説明します。
他の一般的なフォーマット
このフォーマットを設計する過程では、他にも多くの一般的なフォーマットが検討されました。 その普及度は、Profilerpediaサイトのデータに基づいて評価されました。 この章では、検討されたもっとも注目すべきフォーマットについて説明します。
折りたたみスタック(Folded Stacks)
折りたたみスタック表現は、シンプルなテキストベースのフォーマットに根ざしていますが、それ自体にいくつかの限界があります。 主な限界は、大規模なデータセットを扱う際の非効率性であり、データの複雑さと量の両方に苦戦する可能性があります。 このフォーマットの定義にも欠点があり、標準化された機械可読な属性が存在しないため、プロファイリングツールや分析ソフトウェアによって解釈や実装が異なるという結果を招いています。
Chromiumのトレースイベントフォーマット
JSONを基盤とするChromiumのトレースイベントフォーマットは、一定の限界を示しています。 特に、ペイロードサイズの効率性の面で優れておらず、集約に対する堅牢なサポートを欠いています。 さらに、その仕様には弱点があり、機械可読な属性を欠いているため、PerfettoやCatapultなど、さまざまな実装で異なる解釈がなされています。
Linux perf.data
主に低レベルのデータ収集を目的としたLinux perf.dataフォーマットは、高レベルの分析には適さない粒度の洞察を提供します。 Performance Monitoring Unit(PMU)によって生成されるイベントとメタデータを含んでいるため、そのフィールドの多くは、主にカーネルレベルで収集されたデータで意味を持ちます。
Java Flight Recorder(JFR)
Java Flight Recorder(JFR)は、Javaエコシステム以外のアプリケーションをプロファイリングするための最適な選択肢ではないかもしれません。 Javaプロファイリングに特化しているため、他のプログラミング言語に依存する環境での適用性が限られており、Java以外のアプリケーションには適していません。
代替の表現方法
データモデルを洗練させる過程で、次のような複数の代替の表現方法が検討されました。
pprof表現は、オリジナルのpprof形式のデータです。denormalized表現は、すべてのメッセージが埋め込まれ、インデックスによる参照が一切使われない表現です。 もっともシンプルな表現ですが、CPU使用率、メモリ消費量、結果として得られるprotobufペイロードのサイズの点で、(大差で)もっとも非効率でもあります。normalized表現は、頻繁に繰り返されるメッセージを別のテーブルに格納し、インデックスによって参照する表現です。 詳細はこの章を参照してください。 このテクニックにより、結果として得られるprotobufペイロードのサイズと、そのようなペイロードをパースするために割り当てる必要があるオブジェクトの数を削減できます。arrays表現は、normalized表現に基づいていますが、メッセージを表現するために構造体の配列ではなく整数の配列を使います。 これにより、割り当ての数と結果として得られるprotobufペイロードのサイズがさらに削減されます。pprofextendedは、変更を加えたpprof表現です。 これが本OTEPで示されている表現です。
それぞれの正確なprotoの定義はこちらで確認できます。
これらの代替の表現方法により、プロファイリングデータを表現するためのさまざまなテクニックを絞り込むことができました。 上記の表現はいずれも、本OTEPで示されているデータモデルと比較してパフォーマンスが劣ることがわかりました。 詳細は次のセクション、ベンチマークを参照してください。
ベンチマーク
ベンチマークはGoのベンチマークツールを使って実施されました。 データモデルを設計する過程で、私たちは多くのベンチマークを実施しました。 すべてのベンチマークは、同じ3段階のプロセスに従います。
- pprof形式のプロファイルを取得する
- 他のフォーマットのプロファイルに変換し、バイト列にシリアライズし、その結果をgzip圧縮する
- 主要なパフォーマンス指標を測定する
すべてのベンチマークでは、いくつかの主要な指標を測定しました。
bytes— 変換およびシリアライズ後のペイロードのサイズgzipped_bytes— gzip圧縮後のペイロードのサイズretained_objects— 変換後に作成され保持されるGoランタイムオブジェクトの数unique_label_sets— 元のpprofファイル内のユニークなラベルセットの数bytes_allocated— 変換中にGoランタイムによって割り当てられたバイト数allocs— 変換中にGoランタイムによって行われた割り当ての数
gzipped_bytesは、ネットワークトラフィックのコストセンターであるため、重要な指標です。
bytes、retained_objects、bytes_allocated、allocsの各指標は、データ生成者および仲介者(コレクターなど)におけるメモリ使用量とガベージコレクションのオーバーヘッドに直接影響するため重要です。
ベンチマーク結果のスプレッドシートには、直近のベンチマーク結果と、これまでのベンチマーク実行の履歴が示されています。 こちらには、ベンチマークの実行方法についての説明があります。 以下は、私たちのグループがこれまでに行ったベンチマークのおおまかな履歴です。
- 「2023年7月23日」、「2023年8月24日」 — 「pprof」「denormalized」「normalized」の各表現の違いを示しています。
- 「2023年10月4日」 — 「pprofextended」表現を導入し、「pprof」および「arrays」と比較しています。 「pprofextended」バージョンは全体として「pprof」よりも優れているものの、「arrays」ほどではないことを示しています。
- 「2023年10月6日」対「スタックトレース削除後(2023年10月6日)」 — スタックトレースを別の構造体として表現する方法と、別の整数配列として表現する方法の違いを示しています。 retained_objectsの大幅な削減を示しています。 スタックトレース構造体の削除後は、「pprofextended」表現の方が「arrays」表現よりも優れていることを実証しています。
- 「属性表現(2023年10月13日)」 — 異なる属性表現の違いに焦点を当てています。 属性のためのルックアップテーブルを持つことが、他の表現と比較して最適であることを示しています。
以下は、もっとも注目すべきサンプルプロファイルに対するベンチマーク結果です。
「average」プロファイル
このベンチマークのソースは、シンプルなGoプログラムから収集された、10秒間の単一のpprofプロファイルです。 これは、実行中のアプリケーションから収集される典型的なプロファイルを表しています。
| name | bytes | gzipped_bytes | retained_objects | unique_label_sets | bytes_allocated | allocs |
|---|---|---|---|---|---|---|
| pprof | 7,974 | 3,772 | 653 | 1 | 876,968 | 824 |
| denormalized | 83,204 | 3,844 | 3,166 | 1 | 1,027,424 | 3,191 |
| normalized | 7,940 | 3,397 | 753 | 1 | 906,848 | 1,815 |
| arrays | 7,487 | 3,276 | 586 | 1 | 922,948 | 2,391 |
| pprofextended | 7,695 | 3,347 | 654 | 1 | 899,400 | 779 |
各サンプルにタイムスタンプを追加した「average」プロファイル
ソースは前の例と同じですが、今回はプロファイル内の各サンプルにタイムスタンプが追加されています。
| name | bytes | gzipped_bytes | retained_objects | unique_label_sets | bytes_allocated | allocs |
|---|---|---|---|---|---|---|
| pprof | 9,516 | 3,787 | 968 | 1 | 898,696 | 1,568 |
| denormalized | 121,396 | 4,233 | 4,536 | 1 | 1,126,280 | 4,894 |
| normalized | 9,277 | 3,394 | 900 | 1 | 925,904 | 2,632 |
| arrays | 8,877 | 3,309 | 588 | 1 | 946,468 | 3,306 |
| pprofextended | 8,863 | 3,387 | 806 | 1 | 919,904 | 1,476 |
非常に深いスタックトレースを持つ「Ruby」プロファイル
このテストのソースは、非常に深いスタックトレースを持つRubyアプリケーションから収集された集約済みpprofプロファイルです。
| name | bytes | gzipped_bytes | retained_objects | unique_label_sets | bytes_allocated | allocs |
|---|---|---|---|---|---|---|
| pprof | 1,869,549 | 115,289 | 19,759 | 1 | 14,488,578 | 42,359 |
| denormalized | 163,107,501 | 4,716,428 | 3,840,093 | 1 | 319,473,752 | 3,844,625 |
| normalized | 1,931,909 | 130,565 | 46,890 | 1 | 315,003,144 | 1,725,508 |
| arrays | 1,868,982 | 120,298 | 23,483 | 1 | 314,117,160 | 1,689,537 |
| pprofextended | 841,957 | 94,852 | 19,759 | 1 | 20,719,752 | 33,410 |
「large」プロファイル
このテストのソースは、Goアプリケーションから長期間(24時間)にわたって収集された集約済みpprofプロファイルです。
| name | bytes | gzipped_bytes | retained_objects | unique_label_sets | bytes_allocated | allocs |
|---|---|---|---|---|---|---|
| pprof | 2,874,764 | 1,110,109 | 350,659 | 27 | 27,230,584 | 470,033 |
| denormalized | 87,887,253 | 6,890,103 | 2,287,303 | 27 | 190,243,856 | 2,325,604 |
| normalized | 2,528,337 | 953,211 | 333,565 | 27 | 46,449,824 | 1,274,000 |
| arrays | 2,251,355 | 999,310 | 213,018 | 27 | 60,971,752 | 1,904,756 |
| pprofextended | 2,398,961 | 872,059 | 274,140 | 27 | 38,874,712 | 353,083 |
結論
多くのベンチマークを実施し、その結果を分析した結果、次のような結論に至りました。
pprof表現は良好ですが、OpenTelemetryの標準とのより深い統合を欠いており、パフォーマンスの面で改善の余地があります。denormalized表現は、normalized表現と比較して、CPU使用率、メモリ消費量、結果として得られるprotobufペイロードのサイズの点で、著しくコストがかかります。 本番環境での使用には適していません。normalized表現はdenormalized表現よりもはるかに優れています。arrays表現は概してnormalized表現よりも優れていますが、データモデルに大きな変更をもたらし、理解しやすいとは言えません。pprofextended(本OTEPで使われている表現)は、パフォーマンスとシンプルさの完璧な組み合わせです。 CPU使用率、メモリ消費量、結果として得られるprotobufペイロードのサイズの点でnormalized表現よりも著しく優れていますが、オリジナルのpprofにより近く、arrays表現よりも理解・実装が容易です。
セマンティック規約
私たちは、プロファイルタイプや単位など、さまざまな属性や列挙型についてOTelセマンティック規約を活用する予定です。 以下は、データモデルで使われているセマンティック規約の非網羅的なリストです。 これは今後、洗練・拡張されていくことが見込まれます。
プロファイルタイプ
以下は、可能なプロファイルタイプのリストです。 これは網羅的なものではなく、今後さらにプロファイルタイプが追加されていくことが見込まれます。
cpuwallgoroutinesalloc_objectsalloc_spaceinuse_objectsinuse_spacemutex_contentionsmutex_delayblock_contentionsblock_delay
プロファイルの単位
以下は、可能なプロファイルの単位のリストです。 これは網羅的なものではなく、今後さらに単位が追加されていくことが見込まれます。 これらの単位の一部については、UCUMが参照として使われます。
bytessamplesnsmscount
意思決定ログ
設計プロセスの中では、他にも多くの代替案が検討されました。 設計プロセス中に行われたさまざまな決定についての詳細は、意思決定ログを参照してください。
未解決の課題
データモデルに関するいくつかの細かい詳細については、まだ議論が続いており、今後のOTEPで明らかにされる予定です。 私たちは、クライアント・コレクター・バックエンドの初期実装を使った実験を行い、コミュニティからのフィードバックを得た後、これらの詳細を確定させるつもりです。 本OTEPの目標は、こうした実験と、今後の可能性のための確固たる基盤を提供することです。
以下は未解決の課題のリストです。
属性における単位
オリジナルのpprofフォーマットでは、属性に単位を指定できます。
現在のデータモデルは、(Sampleメッセージ内のattribute_unitsを参照)文字列テーブルを使う類似の概念をサポートしています。
単位をKeyValueメッセージ内で直接指定できるようにするのは良い考えかもしれません。
しかし、そのような変更は事実上すべてのシグナルに変更が必要になり、それだけの価値があるかどうかは明らかではありません。
私たちは今後この問題を調査するつもりであり、価値があると判断すれば、この変更を行うための別のOTEPを提出します。
タイムスタンプ
データモデルにはタイムスタンプのサポートがありますが、それをどのように使うべきかは明らかではないため、今後さらに実験を行った上でこの部分のデータモデルに変更を加えることを見込んでいます。
属性キーの繰り返し
オリジナルのpprofフォーマットでは、繰り返される属性キーを効率的にエンコードできます。
たとえば、3つの属性が同じキーを持つ場合(pid: 1、pid: 2、pid: 3など)、キーは文字列テーブルに一度だけ格納されます。
現在のデータモデルはこの最適化をサポートしていません。
私たちは、この最適化が本当に必要かどうかを調査するつもりであり、必要であれば今後データモデルに追加します。
ロケーションの最適化
サンプルとロケーション間の関係セクションでは、結果として得られるprotobufペイロードのサイズと、そのようなペイロードをパースするために割り当てる必要があるオブジェクトの数を削減するために使われているテクニックについて説明しています。 しかし、このテクニックがデータモデルをより複雑にするという懸念があり、特に次のような点が挙げられます。
- ある程度カスタムなメモリ管理が必要になり、配列の範囲外アクセスのような問題が見過ごされる可能性があること
- 2つ以上のプロファイルに対する
Merge関数の実装が難しくなること
私たちは、クライアント・コレクター・バックエンドの初期実装を使った実験を行いながら、今後この問題を調査するつもりです。 それだけの価値がないと判断すれば、この変更を取り消すための別のOTEPを提出します。
今後の可能性
本OTEPにより、私たちはOTel仕様のさまざまな部分に取り組み始めることができます。
- プロファイルデータモデル
- プロファイルAPI
- プロファイルSDK
それはさらに、次のような取り組みを開始することを可能にします。
- OTelコレクターにおけるプロファイルのサポート
- さまざまな言語(GoやJavaなど)でのクライアントSDK実装