First published: Last updated:
The Collector and Operations
Originally published in Japanese at https://zenn.dev/ymotongpoo/books/tinygo-otel-esp32/viewer/50-collector.
Even when the device can speak OTLP, nobody reads its telemetry if it has no destination. The device’s destination is an OpenTelemetry Collector on the same LAN (a server program that receives telemetry, processes it, and forwards it to another destination; the Collector from here on). This chapter looks at the configuration of the Collector, and at the results of running the device and the Collector together for 30 minutes.
The path from the device to Grafana
The setup has three stages: the device, the Collector, and a backend for visualization. The device sends OTLP over plain HTTP to the Collector on the LAN. The Collector adds attributes and then forwards the data to the backend.
The backend is grafana/otel-lgtm. It is an image for development and testing. It bundles the following in one container: an endpoint that accepts OTLP, Prometheus to store metrics, Loki to store logs, Tempo to store traces, and Grafana to display them.
I start the Collector and otel-lgtm together with Docker Compose. otel-lgtm also accepts OTLP directly, so the device could send to it directly. I still put the Collector in between, because the setup needs a place that takes on the work of sending data beyond the device.
make stack # edge collector (:4319) + grafana/otel-lgtm (:3000)
On the host, I use port 4319 instead of 4318, because another local Collector or Grafana Alloy often uses port 4318.1 For the endpoint that you write to the device, specify the LAN address of the machine that runs the Collector. From the device, localhost is the device itself, so localhost does not reach the Collector.
The Collector configuration
You write the Collector configuration in two steps. You define components for receiving (receivers), processing (processors), and sending (exporters). Then you connect them in a pipeline for each signal. The following excerpt from this book’s configuration shows the parts that relate to the metrics pipeline.
receivers:
  otlp:
    protocols:
      http:
        endpoint: 0.0.0.0:4318

processors:
  resource:
    attributes:
      - key: deployment.environment.name
        value: demo
        action: upsert
  batch:
    timeout: 5s

exporters:
  otlphttp/lgtm:
    endpoint: http://lgtm:4318
    tls:
      insecure: true

service:
  pipelines:
    metrics:
      receivers: [otlp]
      processors: [resource, batch]
      exporters: [otlphttp/lgtm]
The receiver listens on 0.0.0.0. By default, the Collector listens only on localhost. The device sends plain HTTP from a different machine on the LAN, so the Collector must also accept connections on its LAN interface.2
The resource processor rewrites the resource attributes (attributes that describe the sender) of the data that it receives. The excerpt adds deployment.environment.name. The full configuration also adds telemetry.sdk.language and telemetry.sdk.name in the same place. The device itself sends only four resource attributes: service.name, service.version, device.id, and device.model.identifier.
The Collector adds deployment.environment.name because the device does not know which environment it runs in. The person who installs the firmware knows whether it goes on a test LAN or in production equipment. If the device held this attribute, it would also send the same bytes over Wi-Fi at every export.
The batch processor holds the data that it receives for up to 5 seconds and then sends it as one batch. The log and trace pipelines use the same combination of components, and the signals share the receiver, processor, and exporter settings.
The configuration also includes the debug exporter, which writes a summary of the received data to the Collector’s own log. When Grafana shows nothing, this exporter is your first way to check whether the data reaches the Collector.
The dashboard
I provision a dashboard for the device in Grafana (provisioning means that Grafana loads it from a configuration file automatically at startup). It has 8 metrics panels, 1 log panel, and 2 trace panels.
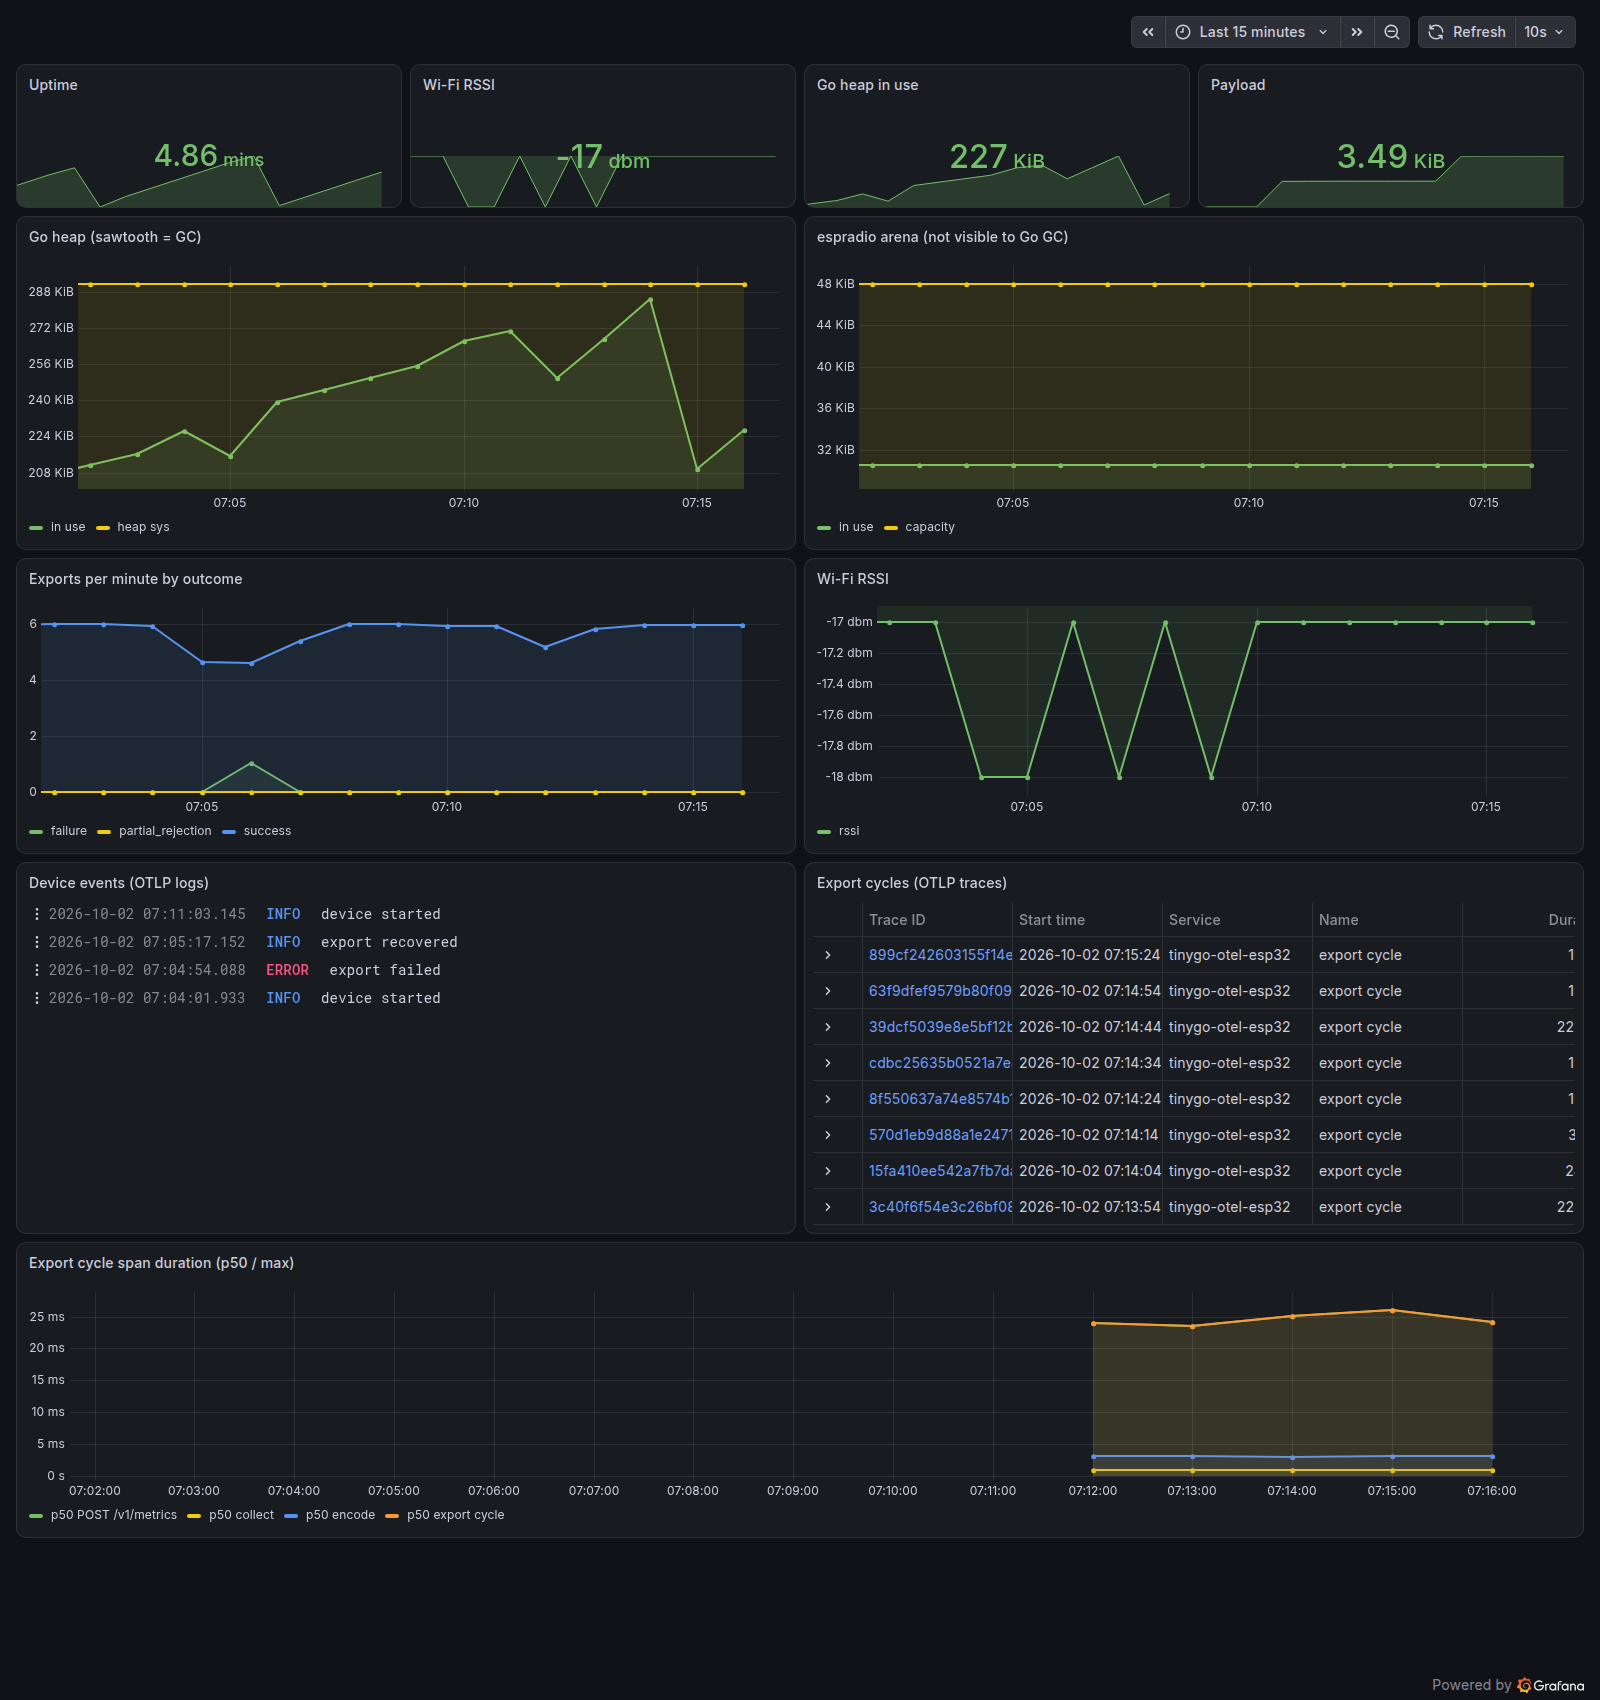 Figure 1: A dashboard that shows the three signals from the device on one screen. The top row shows metrics. In the middle row, the left side shows the logs that reached Loki, and the right side shows the export-cycle traces that reached Tempo. The bottom row shows the duration of each span over time.
The Go heap panel has a sawtooth shape, because usage drops at each GC. To its right, I placed the panel for the arena of the Wi-Fi driver. As the previous chapter mentioned, this placement lets you compare the Go heap with the memory of the driver. The log panel shows export failed, from when I stopped the Collector, and export recovered, from after it came back. They appear in the order of the times when the events happened.
The durations in the bottom row are metrics that the span metrics generator of Tempo creates from the spans. The device does not send duration metrics. If the device sends traces, it can leave the aggregation of durations to the backend.
Recovery from a Collector restart
I used a soak run to check whether the device and the Collector keep running together for a long time. The conditions were JSON with the hand-written HTTP client, a 16 KB stack, a 10-second export interval, and a duration of 30 minutes. In the middle of the test, at the 15-minute mark, the test restarts the Collector container.
A Python script on the host runs the test. The script reads the output of the device from the serial port. From each line that reports a successful export, it extracts the payload size and the heap usage. A point where heap usage is lower than the previous value is a GC. At a specified time, the script restarts the Collector with docker restart. It then measures the time until the first successful export after the restart. If even one line that reports a failure or a panic appears, the test fails.
I ran this test on the version that sends only metrics and on the current version that sends three signals.
| Item | Metrics only | Three signals |
|---|---|---|
| Exports | 180 | 180 |
| Failures | 0 | 0 |
| Heap growth per export | 800 bytes | 2,992 bytes |
| GCs | 1 | 7 |
| Heap after GC | 178,704 bytes | 203,776–206,128 bytes |
| Recovery from the restart | 6.1 seconds | 9.1 seconds |
Neither version had a single failure in 30 minutes. The three-signal version ran GC more often because it has more short-lived allocations. But the heap after GC stayed at about 204 KB all 7 times, so memory did not keep growing.
The recovery time depends on the wait from the restart to the next export cycle. If the Collector finishes its restart within the 10-second export interval, the device succeeds at the next cycle. The difference between 6.1 seconds and 9.1 seconds comes from where in the cycle the restart happened. The device reuses its connection. When the Collector goes down and the connection drops, the device opens a new connection at the next cycle and resumes exports.
Dividing the work between the device and the Collector
In this setup, the device and the Collector divide the work between them. The criterion for the division is whether the information or the processing is available only on the device.
The device keeps only what it alone can know. Nothing outside the device can measure the heap and arena usage, the RSSI, the export results, or the times when events happened. On top of that, the device sets an upper limit on its buffers, and it sends the number of overflowed records as metrics. The destination is the Collector on the same LAN, over plain HTTP.
The Collector takes on what the device does not know and what does not fit on the device. The Collector adds attributes that the installer decides, such as the environment name. If you send to a backend across the internet, the TLS settings and the credentials also go in the Collector. espradio v0.3.0 has no working TLS client. Even if it had one, you would have to distribute certificates and private keys to every device and keep them up to date. Retries when the backend does not respond for a while, and buffering of data before export, are also the work of the Collector. A Collector that runs on a server does not need to fit in 416 KB of SRAM.
Once the link from the device to the Collector speaks OTLP, everything beyond it is the same setup as when you use OpenTelemetry on a server. In this book’s setup, nothing in the configuration beyond the Collector is specific to microcontrollers.
You can change the port with the
COLLECTOR_PORTenvironment variable. The Collector inside the container listens on port 4318. ↩︎When you widen the listening address, the Collector accepts telemetry from anyone on the same network. This book’s setup assumes a LAN with a limited scope, such as a home network or a venue network. ↩︎