Running the Reference Implementation
Originally published in Japanese at https://zenn.dev/ymotongpoo/books/observability-platform-with-otel/viewer/80-reference_implementation.
otel-platform-blueprint is a reference implementation that combines an SDK distribution, zero-code instrumentation, the Collector, OpAMP, and Weaver. I measured the behavior and the numbers in this chapter in the following environment.
| Item | Value at the time of measurement |
|---|---|
| Measurement date | September 10, 2026 |
| OS | Linux (x86_64, 4 cores) |
| Docker Engine | 29.0.0 |
| Go | 1.26.0 |
| Collector | v0.159.0 |
| opentelemetry-go | v1.45.0 |
| Weaver | v0.25.1 |
| OpAMP Supervisor | 0.159.0 |
| otelc | v1.1.0 |
The repository records the details in docs/measurements.md. These versions differ from the latest versions that the other chapters give. I list the versions from the time of measurement as they are, to keep a combination that reproduces the numbers. I also ran the same scenarios on macOS on August 25, 2026. This chapter states each place where the results differ.
The following figure shows the verification steps in this chapter and the design that each step confirms.
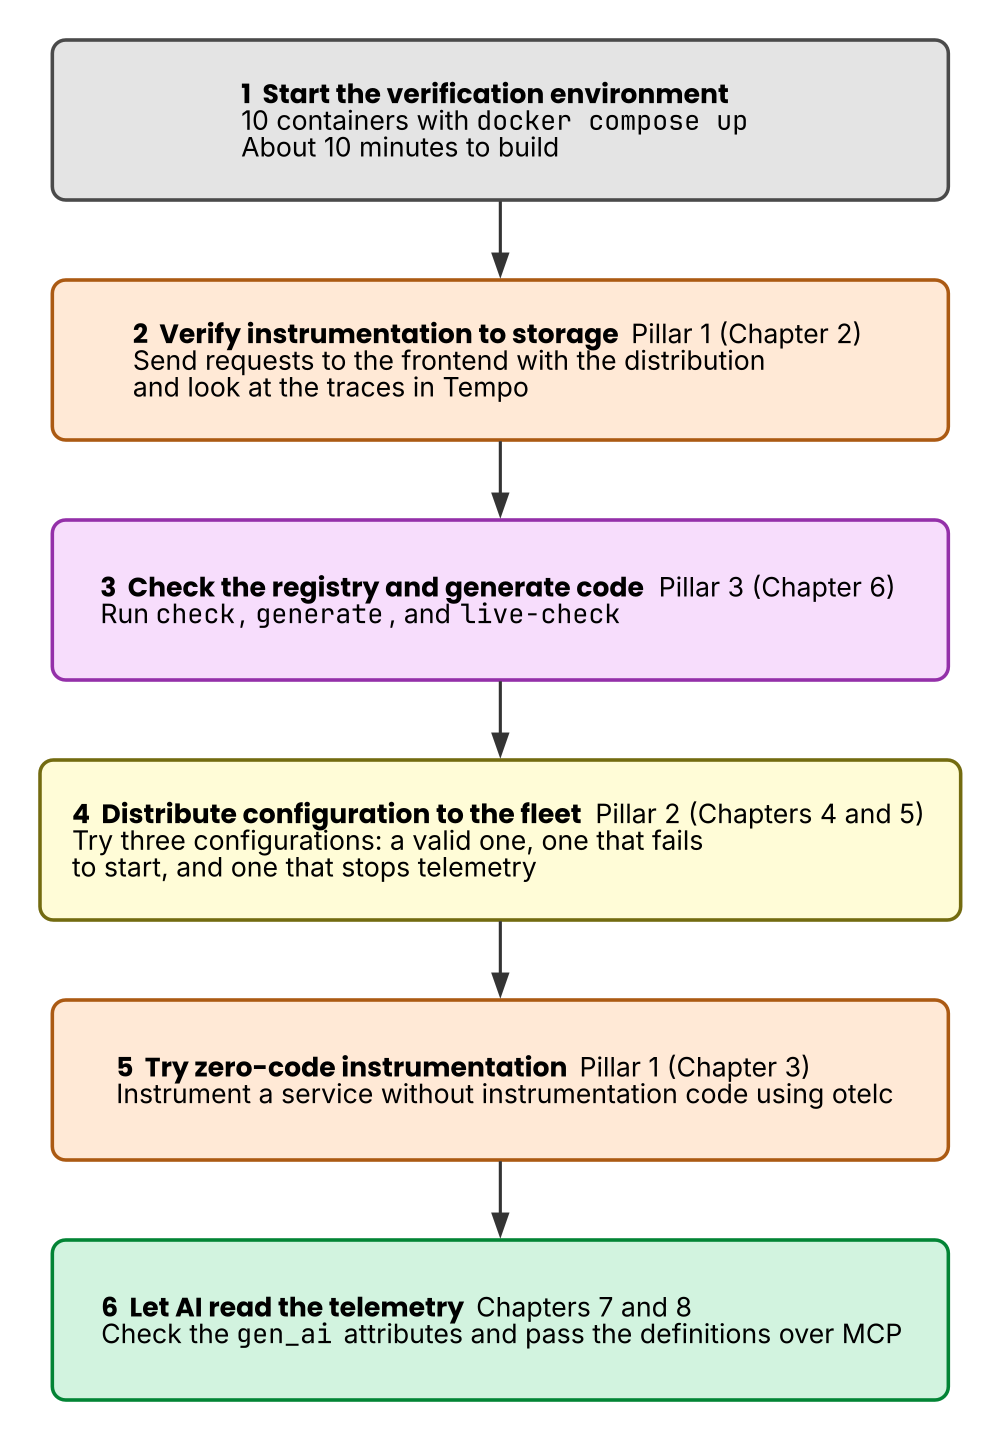 Figure 1: Run the steps from top to bottom. The color of each box shows the pillar that the step confirms: orange for the first pillar, yellow for the second, purple for the third, and green for AI workloads. Zero-code instrumentation belongs to the first pillar. It comes near the end because the difference is easier to see after the environment is running.
The structure of the repository
Each directory corresponds to a chapter of this book.
otel-platform-blueprint/
├── sdk/              # Internal SDK distribution (Chapter 2)
│   ├── otelinit/     #   Initialization with a single Setup call
│   └── semconv/      #   Constants for internal attributes, generated by Weaver
├── autoinstrument/   # Zero-code instrumentation (Chapter 3). Example build with otelc
├── collector/        # Collector build and configuration (Chapter 4)
│   ├── builder/      #   manifest.yaml for OCB
│   └── configs/      #   Predefined configurations for the agent and the gateway
├── opamp/            # Fleet management (Chapter 5)
│   ├── server/       #   Minimal OpAMP server based on opamp-go (for learning)
│   ├── supervisor/   #   supervisor.yaml and the base configuration of the agent
│   └── remote-configs/ # Remote configurations to distribute to the fleet
├── registry/         # Semantic conventions registry (Chapter 6)
│   ├── model/        #   manifest.yaml and the YAML definitions of internal attributes
│   ├── policies/     #   Rego policies
│   └── templates/    #   Templates that generate Go constants
├── services/         # Go services for the demo
│   ├── frontend/     #   Distribution built in
│   ├── backend/      #   Same as above. Also emits logs with otelslog
│   ├── uninstrumented/ # No instrumentation code (for the zero-code instrumentation demo)
│   └── ai-app/       #   Agent-like app that includes LLM calls (Chapter 7)
├── ai-ops/           # Example setup that lets AI read telemetry (Chapter 8)
├── deploy/           # docker compose and backend configuration
└── docs/             # Measurement records
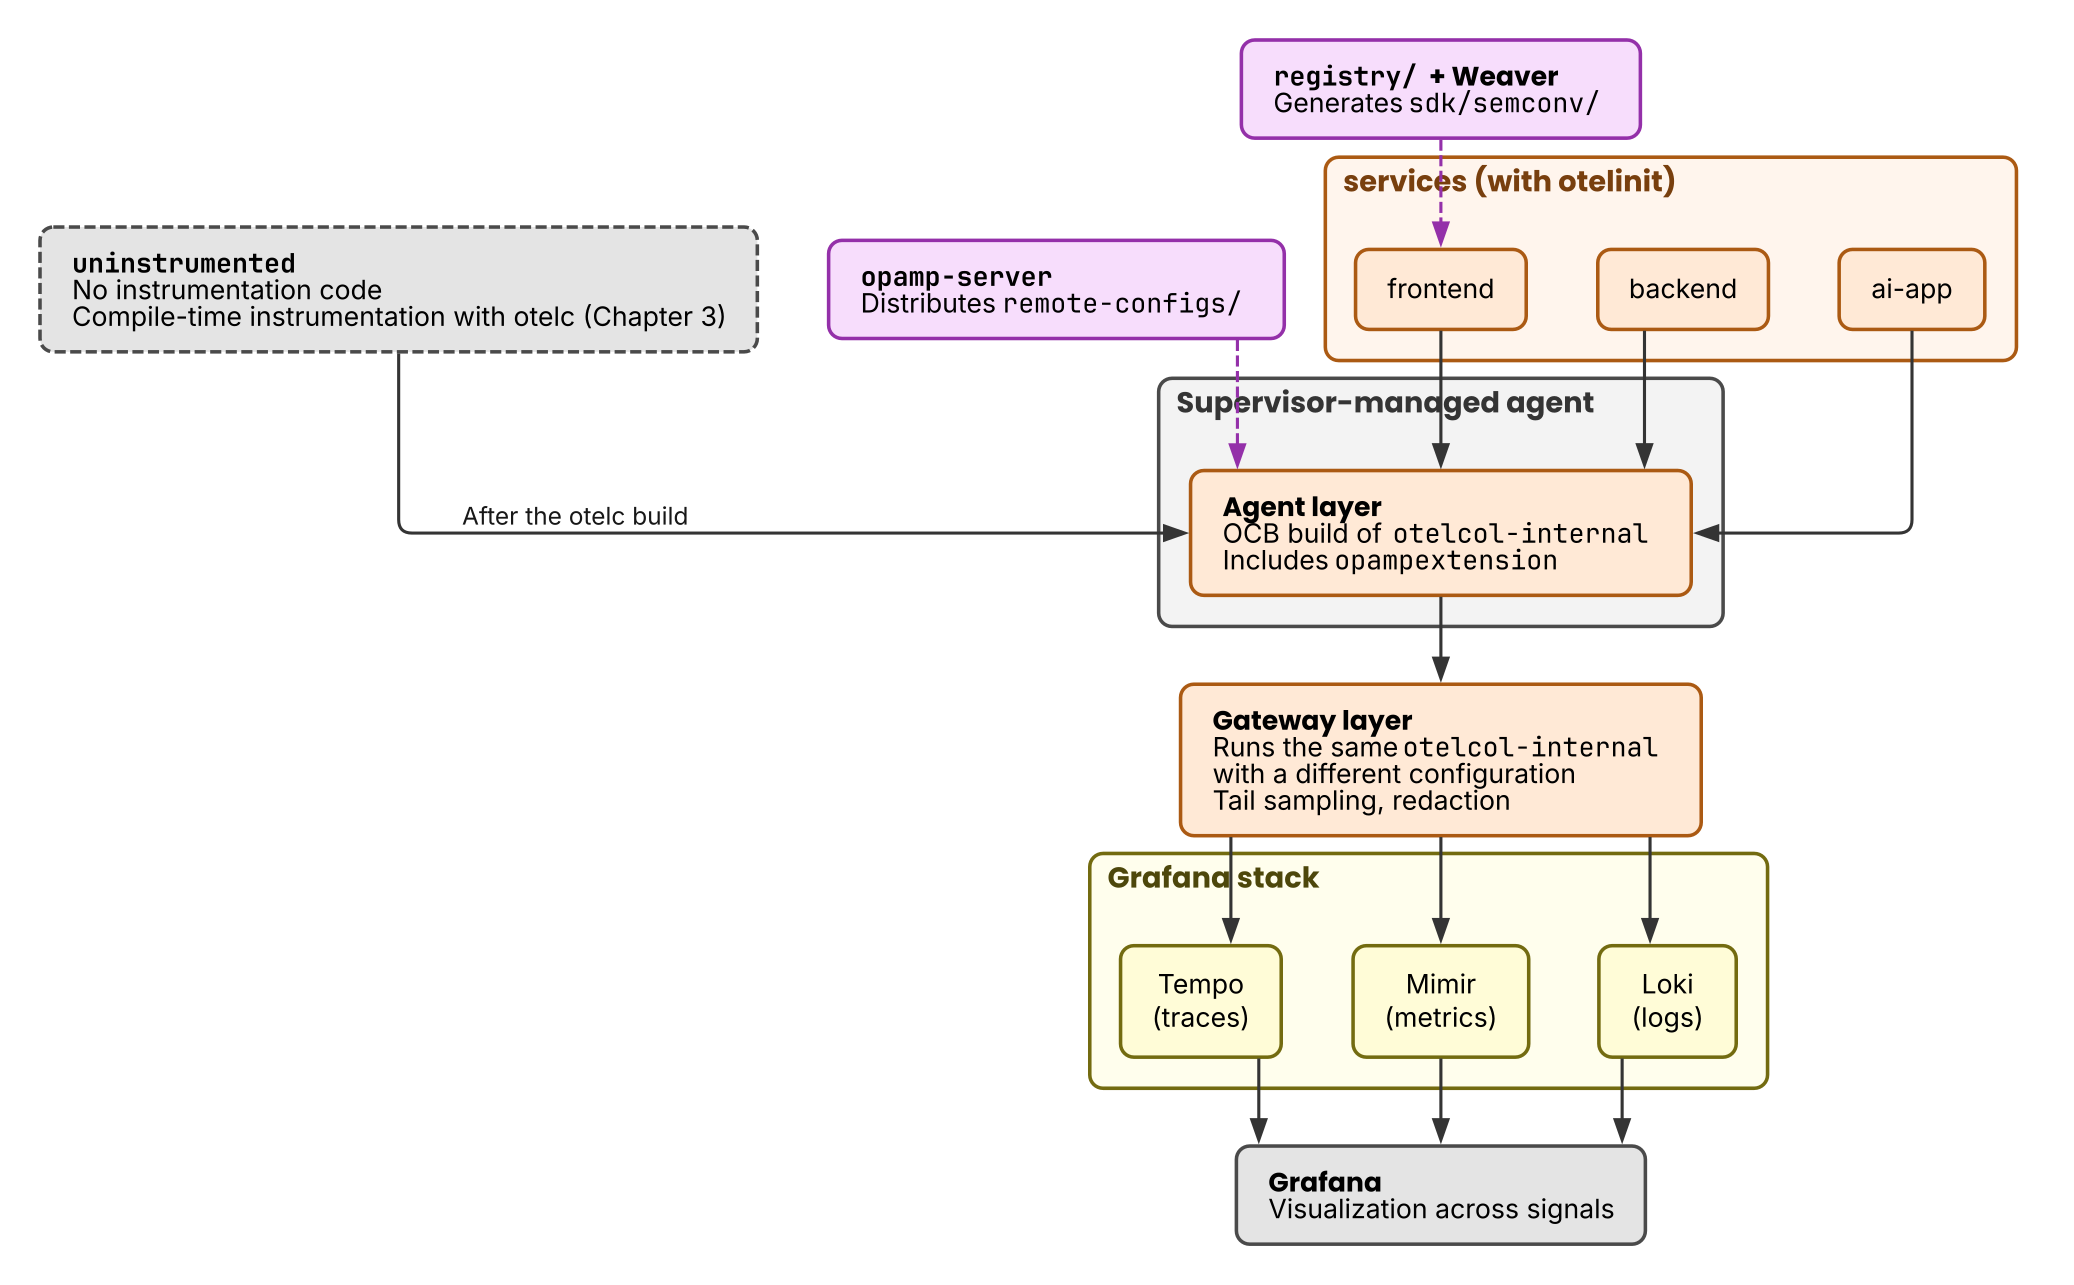 Figure 2: Solid lines show the flow of telemetry, and dotted lines show where configuration and generated artifacts go. The figure adds the component names of the implementation to Figure 2 in Chapter 1.
Starting the verification environment
The verification backend is the OSS Grafana stack. Traces go to Tempo, metrics to Mimir, and logs to Loki, and you check them in the Grafana UI. The path from instrumentation to OTLP export does not depend on a particular backend. However, search after storage and access from AI agents are specific to the backend. For this implementation, I chose the Grafana stack as an OSS combination that you can start on your own machine.
$ git clone https://github.com/ymotongpoo/otel-platform-blueprint
$ cd otel-platform-blueprint/deploy
$ docker compose build gateway
$ docker compose up -d --build
Build gateway first. The agent image that the Supervisor manages uses otelcol-internal:dev as its base image, and otelcol-internal:dev is the artifact of the gateway build. Compose does not guarantee a build order between services. If you only build everything at once, the agent build can fail with pull access denied.
The first run builds the Collector with OCB and builds the Go services. On a machine with 4 cores, this took about 10 minutes. Ten containers start: the Grafana stack, the internal Collectors built with OCB (the gateway and the agent that the Supervisor manages), the OpAMP server, and four demo services.
Port conflicts and the wait for Tempo to start can cause trouble. The README of the repository describes the fixes.
Verifying the path from instrumentation to storage
To check the path from instrumentation to storage, send requests to frontend, which has the distribution built in.
$ for i in $(seq 30); do curl -s localhost:8080/checkout > /dev/null; done
Of the 30 requests, 7 traces reached Tempo. The tail sampling at the gateway keeps all errors and 10% of the successful traffic. The decision is probabilistic, so the number of stored traces changes from run to run under the same conditions: another run stored 6 traces, and the first run on macOS stored 2. The number of requests that you send does not match the number of traces that Tempo stores. The stored traces show the following.
- The spans of frontend and backend join into a single trace. The only instrumentation code in the application is
otelinit.Setup(ctx), and no propagator configuration appears anywhere (Chapter 2). - The resource attributes contain
host.name, which the resource detection of the agent added. They also containdeployment.environment.nameandteam.name, which come through the standard environment variableOTEL_RESOURCE_ATTRIBUTES(Chapters 2 and 4). - The spans carry
com.example.delivery.id, and the source code writes this attribute with a constant that Weaver generated.sdk/semconv/contains no handwritten strings for attribute names (Chapter 6).
I also checked the attribute processing at the gateway. The frontend service deliberately adds user.email to its spans. The traces stored in Tempo do not have this attribute, but com.example.delivery.id remains. The Transform processor removed user.email in transit.
Metrics and logs travel the same path. http_server_request_duration from otelhttp reached Mimir, and the logs that backend emitted with otelslog reached Loki. The log entries carry trace_id and span_id, so you can search for the logs that are related to a trace.
Checking the registry and generating code
Run the governance loop from Chapter 6.
$ ./registry/weaver.sh check
$ ./registry/weaver.sh generate
The check command resolved the dependency on the official semconv through a Git URL and succeeded in about 3 seconds. I also confirmed that it detects violations. When I defined myteam.custom.flag, which is in a namespace other than com.example., check failed with an internal_namespace_only violation from the Rego policy. When I removed this definition, check succeeded again. The generate command produced sdk/semconv/semconv.go and converted com.example.delivery.id into the constant ComExampleDeliveryId. The generated file matched the committed file, so no diff appeared, and CI checks for exactly this diff.
The live-check command checks real telemetry. I started live-check as an OTLP receiver. Then I used telemetrygen, the official test tool that generates telemetry, to send spans with an attribute that is not in the registry. live-check reported myteam.rogue.attr as a violation and did not report com.example.delivery.id as one. However, live-check added an improvement suggestion to com.example.delivery.id, because the stability of that attribute is development.
When you run live-check in a container, specify the listen address and the port explicitly. When I started it without these options, the telemetry that I sent from outside the container did not arrive, and live-check exited with nothing checked. registry/weaver.sh solves this with --otlp-grpc-address 0.0.0.0 --otlp-grpc-port 4317. However, the default in v0.25.1 is the same 0.0.0.0:4317, so the default listen address did not cause the empty result. The state of the published ports or the default idle timeout of 10 seconds may have played a part, but I did not identify the cause. Since v0.26.0, the default listen address is 127.0.0.1, so from that version on you must specify the address when you run live-check in a container.
On the other hand, live-check also reported attributes from the official registry, which my registry depends on, as violations. Examples are service.name and network.peer.address. The scope within which live-check resolves dependencies needs further investigation. If you use live-check to pass or fail a CI run, you need to handle each detected violation according to its kind.
Distributing configuration to the fleet
The Supervisor starts the agent. When opamp/remote-configs/remote.yaml changes, the OpAMP server distributes the change to the connected Supervisors. I tried three configurations: a valid one, one that fails to start, and one that starts but stops telemetry.
I wrote a processor that adds an attribute to spans into the remote configuration and saved the file. Within 2 seconds, the status became APPLIED, and the spans after that point carried a new fleet.config.version. I did not redeploy the Collector. The OpAMP server in this implementation polls the configuration file every 2 seconds, so that interval sets the detection delay.
When I distributed a configuration that references a processor that does not exist, the Supervisor detected the startup failure in about 1 second and reported FAILED. However, a server that resends whenever the applied hash differs from the distributed hash keeps sending the same configuration after FAILED. To prevent this, I implemented a control in opamp/server/main.go that does not resend a hash that a Supervisor reported as FAILED.
The Supervisor side had a problem too. I had enabled automatic_config_rollback, but 0.159.0 did not recover to the previous configuration on its own. On both macOS and Linux, I confirmed that the Supervisor persists the configuration that failed to start into last_working_remote_config.dat as the “last working configuration”. The status stayed FAILED for the 30 seconds that I observed it. The agent recovered when the server distributed a corrected configuration.
A configuration that drops all spans with filter started successfully, and the status stayed APPLIED and healthy. I sent 50 requests, and 0 traces reached Tempo. No rollback happened either. When I distributed a valid configuration again, the agent recovered, and 6 traces from 25 requests reached Tempo.
In this measurement, automatic rollback alone did not protect the fleet. You need to combine canaries, monitoring of telemetry arrival, prevention of resends for FAILED configurations, and redistribution of a corrected version.
Trying zero-code instrumentation
Try the compile-time instrumentation from Chapter 3 on services/uninstrumented, which contains no instrumentation code at all.
$ cd autoinstrument/otelc
$ go tool otelc go build -o legacy-instrumented .
$ docker compose -f ../../deploy/docker-compose.yaml stop uninstrumented
$ OTEL_SERVICE_NAME=legacy-otelc OTEL_EXPORTER_OTLP_ENDPOINT=http://localhost:4318 ./legacy-instrumented
otelc go build generates the instrumentation setup only for the duration of the build. The resulting binary is 26,022,431 bytes and includes the instrumentation runtime. The startup log printed “trace provider initialized with auto-export” and “runtime metrics enabled”. Out of 100 requests, 11 traces passed tail sampling and reached Tempo.
I do not use otelc pin, which fixes the setup in the repository. The replace directives that pin writes into go.mod point to absolute paths under the working directory. As a result, if you commit the generated artifacts, the build fails on another machine (package ... is not part of a module). I took the first measurement on macOS, and I had committed the generated artifacts from that run. That is why the second measurement on Linux stopped at this step. As the footnote in Chapter 3 notes, upstream also does not support committing the artifacts that pin generates. In CI, I check that otelc go build succeeds from a plain go.mod.
services/uninstrumented listens on :8082. The binary conflicts with the compose service of the same name, so stop that service before you run the binary on your machine.
For configuration, I used the same standard OTEL_* environment variables as the SDK distribution. This repository does not verify injection through the Instrumentation CRD of the Kubernetes Operator.
Letting AI read the telemetry
services/ai-app is a demo application that reproduces LLM calls and tool execution with stubs. Send a request to /ask and open the trace in Tempo. You can see the following structure.
GET /ask
└── invoke_agent support-agent      gen_ai.agent.name, gen_ai.conversation.id
    ├── chat stub-model-1           gen_ai.request.model, gen_ai.usage.input_tokens ...
    ├── execute_tool search_orders   gen_ai.tool.name
    │   └── HTTP GET
    │       └── GET /inventory     (a regular span from backend)
    └── chat stub-model-1
The LLM calls and the tool execution appear side by side as children of invoke_agent. Below the tool, the distributed trace of the internal API that the tool called continues. The token usage is a stub value that changes with each request. The traces of ai-app are also subject to tail sampling, so 3 traces arrived from 30 requests.
ai-ops/ contains example setups for a registry MCP, which reads the registry, and a telemetry MCP, which reads the real data. The registry MCP starts weaver registry mcp over standard input and output. The telemetry MCP uses an MCP server for the Grafana stack.
This repository does not include the series of experiments in which an AI agent investigates through MCP. If you try the example setups, set separate permissions for the registry and for the real data.
Chapters and directories
| Chapter | Topic | Directory |
|---|---|---|
| Chapter 2 | SDK distribution | sdk/ |
| Chapter 3 | Zero-code instrumentation | autoinstrument/, services/uninstrumented/ |
| Chapter 4 | Collector build and configuration | collector/, deploy/ |
| Chapter 5 | Fleet management | opamp/ |
| Chapter 6 | Registry and Weaver | registry/, sdk/semconv/ |
| Chapter 7 | Observing AI workloads | services/ai-app/ |
| Chapter 8 | Reading telemetry with AI | ai-ops/ |
.github/workflows/ implements the following jobs: check and diff when the registry changes, a check that the generated code is up to date, the OCB build, configuration validation with validate, and otelc go build from a plain go.mod.
A checklist for incremental adoption
The reference implementation starts the parts from all chapters at once, but a real organization can adopt them in stages. This book recommends the following order.
- Set up an agent Collector, and route the telemetry from existing instrumentation through it. Add later shared processing to this path.
- Build an SDK distribution, and start adoption with new services. Migrate existing services when they get their next update.
- Use zero-code instrumentation to give uninstrumented services a minimum guarantee. If you can change the shared CI, start Go services with otelc.
- Set up the gateway layer, and consolidate sampling and attribute governance there.
- Define the registry. First, allow new internal attributes only through the registry. Add generation and live-check after that.
- When the fleet grows and configuration changes become frequent, introduce OpAMP.
- Start the AI extension by ingesting gen_ai attributes. When you give agents access, start with read permission.
You can use the distributed artifacts and checks from each stage without waiting for the later stages.