AI Reads the Telemetry
Originally published in Japanese at https://zenn.dev/ymotongpoo/books/observability-platform-with-otel/viewer/70-ai_driven_operations.
When an alert fires late at night, the on-call engineer opens a dashboard. The engineer searches for traces in the affected time window, looks for what the errors have in common, and checks the logs of related services. An incident investigation moves forward through a series of queries against the telemetry. An agent built on an LLM can run the same steps as tool calls.
A human who looks at a dashboard can sometimes fill in inconsistent attribute names from context. An AI agent that searches telemetry needs a machine-readable way to access the attribute definitions and the actual data.
The AI investigation loop
An incident investigation by an AI agent also does not finish with one query. The agent repeats searches and checks.
- Receive the alert and identify the target service and time window
- Query traces, metrics, and logs across the affected range
- Form a hypothesis from the results (for example: “Since a specific deployment, the error rate has risen only for a specific endpoint”)
- Run more queries to support the hypothesis
- Report the findings, with links to the telemetry that serves as evidence
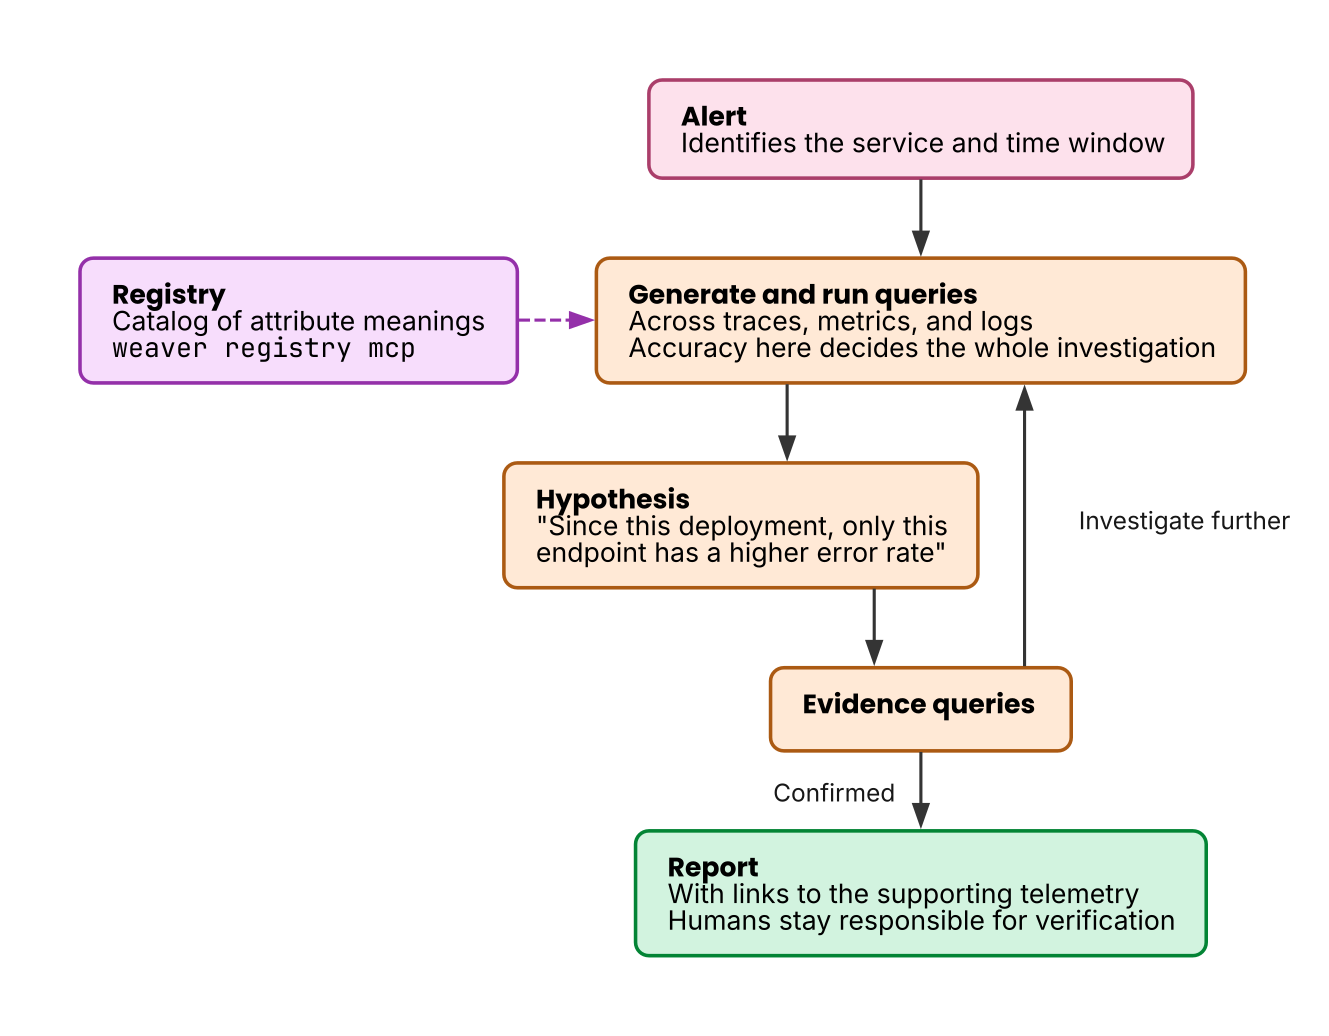 Figure 1: Solid lines show the progress of the investigation, and dotted lines show references to the registry. The agent gets the attribute definitions from the registry each time it builds a query.
An AI agent can run several investigations in parallel. But if a query misses part of the target, the hypothesis and the report that follow are also incomplete. For this reason, you make sure that the agent can choose the attribute names and values in its queries to match the actual data.
Conditions for machine-readable telemetry
In Chapter 1, I stated a hypothesis: if you govern the schema and make it available to machines, you can reduce incorrect queries from AI agents. If a generated query contains an attribute name that does not exist, the result is empty. If the query searches for only one value, it does not include data that uses a different name. For an AI agent to check for inconsistent spellings, it needs a way to look up the definitions of the available attributes and values.
To move between signals, you use exemplars. An exemplar is a mechanism that records a representative trace ID on a metric data point. You can move from a metric to a trace, and then search for related logs by trace ID and span ID.
The following table maps the information that an AI agent uses in its searches to the platform mechanism that provides it.
| Condition | Use in search | Mechanism that provides it |
|---|---|---|
| Attribute names and meanings are consistent | Select the attributes for a query without ambiguity | Semantic conventions and attribute governance in the Collector |
| Resource attributes identify the environment, service, version, and owning team | Decide the search scope and the team to report to | Resource attributes that the SDK distribution and the agent Collector add |
| Metrics, traces, and logs are correlated | Move from an abnormal data point to the related operations and logs | Exemplars, and recorded trace IDs and span IDs |
| Machines can look up the schema | Get the definitions of the attributes and values that actually exist | The internal registry that weaver registry mcp exposes |
You can provide these through the distribution of instrumentation, the Collector layer, and the governance of semantic conventions. However, their effect on the accuracy of an investigation is a hypothesis that you must measure. To evaluate it, use the same incident data and change whether a registry exists and how strictly you govern the schema. Then compare the findings, the attributes that the agent looked up, and the queries that it issued.
Schema disorder and AI failures
The following example is fictional, but it shows the mechanism by which different attribute values cause a search to miss data.
Suppose that errors in the payment system spike, and an AI agent generates a query that filters on service.name=payment. In this environment, the old service uses the name payment, and the new service that replaced it uses payment-api. Most of the errors occurred in the new service. The query returns only the few errors from the old service. The AI agent then reports: “The impact is limited, and the cause is a known bug.” The query results do not include the spans from payment-api. For this reason, you cannot see from the report alone that the search missed data.
Other kinds of disorder cause the same shape of failure.
- A metric with an unknown unit leads to a wrong diagnosis. If the definition does not tell you whether the unit is milliseconds or seconds, you can misread the value by a factor of 1000
- A conflict in meaning goes undetected. The agent aggregates one team’s
statusand another team’sstatusas the same thing, and reports a plausible but false correlation - Missing owner information sends an escalation to the wrong place. Even if the investigation is correct, the incident lasts longer when the report reaches the wrong team
In these failures, the tool calls themselves succeed, and only the search scope is wrong. To check the result, a human must go beyond the report and trace back to the queries and search results that served as evidence. Schema governance and machine access to the schema reduce the chance that the agent uses wrong attribute names and values.
Ways to access telemetry
As of September 2026, people are starting to use MCP (Model Context Protocol) to connect AI agents to telemetry. Observability backend vendors provide MCP servers that expose search tools, and there are also OSS implementations that search several backends. However, OpenTelemetry has no common convention for how AI agents read telemetry, and vendor-specific implementations are ahead.
Give AI agents one connection to read the schema and a separate connection to read the actual data.
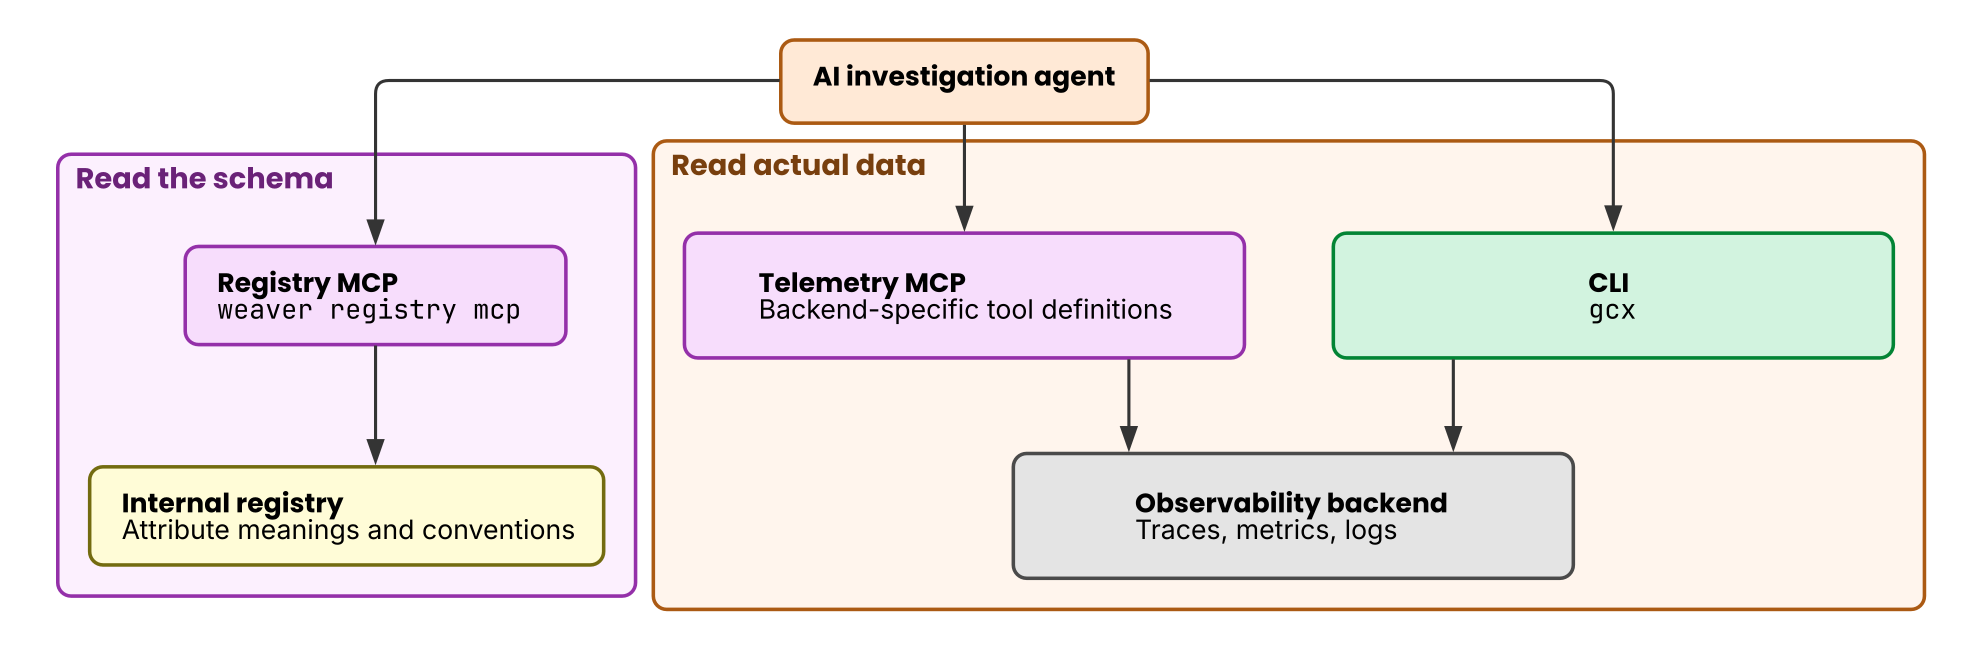 Figure 2: Arrows show read access. The left side is the path to look up the meaning of attributes, and the right side is the path to search the actual data. Separate servers with separate permissions provide the schema and the actual data. You can let many readers see the schema, but the actual data stays under the control of tenant isolation and auditing. The agent can reach the actual data from either the MCP server or the CLI, and the permissions work the same way.
weaver registry mcp exposes a registry that records the meaning of attributes, and it does not handle actual telemetry data. The agent searches the actual data through the MCP server on the backend side. The registry holds definitions that you can share widely inside the organization, but production telemetry needs tenant isolation and auditing. Set a separate authorization for each.
The dedicated repository for the GenAI conventions also includes semantic conventions for MCP (mcp.*). They define a way to propagate a trace by putting W3C Trace Context in the MCP params._meta field. With this, you can also record the queries that an AI agent issues during an investigation as traces.
Give an investigation agent read permissions only. Enforce tenant isolation with the permissions of the backend, and record access in audit logs. If the agent uses the same data access path as humans, you can reuse the existing authorization and auditing.
CLI tools are another way to access telemetry, besides MCP servers. Grafana’s gcx can search metrics, logs, traces, and profiles with one command. It can also manage resources such as dashboards. You can get its output as JSON or YAML, which makes the results easier for an AI agent to parse.
Compared with MCP servers, CLIs have three advantages.
- You can use your existing authentication as is. Before you set up a new MCP server, you can start with the CLI and token that developers already use
- Humans and AI agents can use the same commands. A human can run the command that an AI agent issued and check the result. A human cannot easily reproduce an MCP tool call locally
- An AI agent that can use a shell needs no extra implementation. Coding agents can already run commands, so you can start without configuring a connection
On the other hand, with a CLI you must build paging and partial retrieval yourself, and an MCP server handles these more easily. Provide both: MCP for investigations with a large volume of telemetry, and the CLI for local checks and reproduction.
When you give a CLI to an AI agent, the same rules for permissions apply. Use a read-only token, and do not allow subcommands that write.
A staged design toward autonomous operations
When an AI agent takes part in remediation, expand its permissions in stages. I defined the following four levels for this book. They are not part of the OpenTelemetry specification or a community standard1.
| Level | Short description | Allowed operations | Evaluation before the next level |
|---|---|---|---|
| read | Investigation only | Investigate and summarize telemetry | Accuracy of the reports and of the queries behind them |
| suggest | Up to suggestions | Suggest remediation steps | Suggestions that humans adopted, and the results of running them |
| act | Execution with approval | Run approved, reversible operations | Success rate of operations, and rollback results |
| autonomous | Automatic remediation in a limited scope | Remediate listed, routine incidents automatically | Records of cases outside the scope that the agent handed to humans |
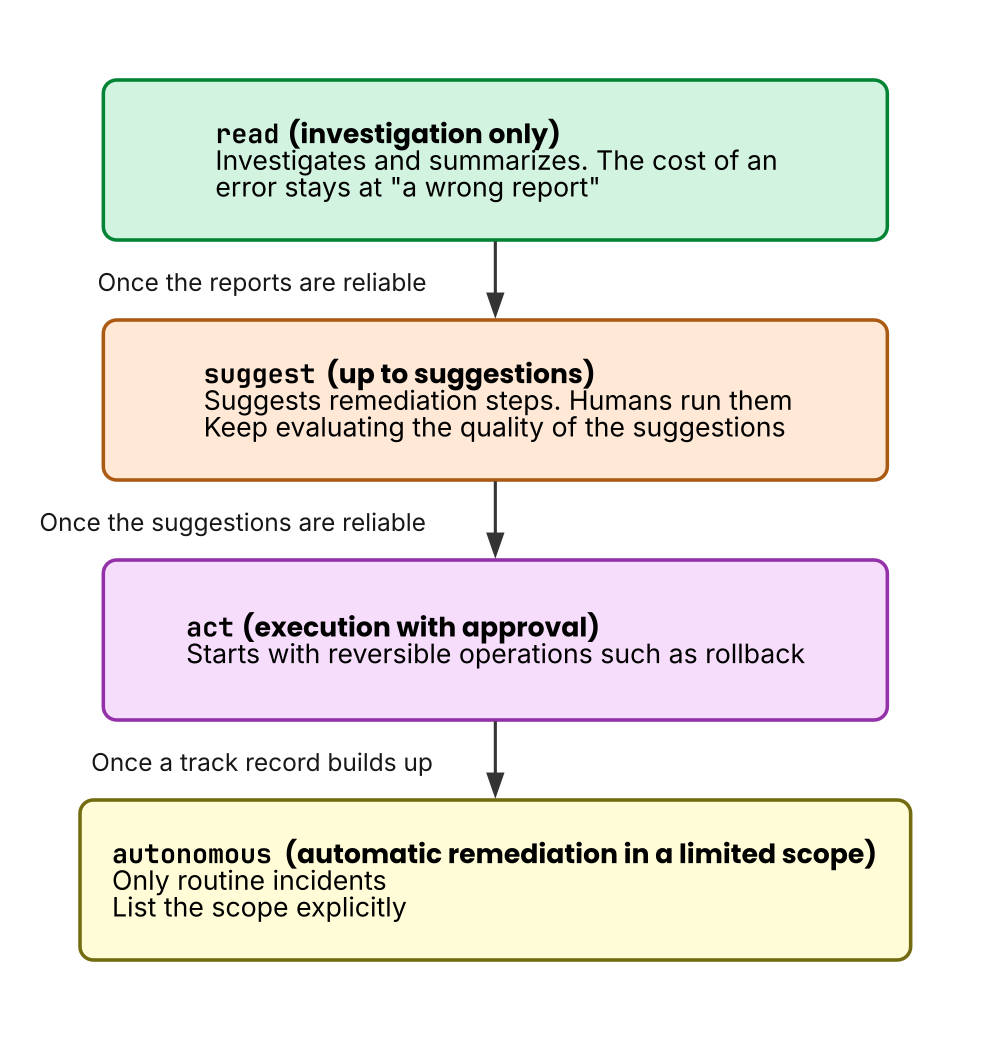 Figure 3: Arrows show the expansion of permissions. You evaluate the results of the previous level before you allow the next operations.
Do not expand permissions while you cannot measure the results of the previous level. For example, if you cannot evaluate the reports and evidence queries at the read level, you have no basis to allow operations at the act level. Include the queried data and the schema in the evaluation criteria, as well as the model. At every level, humans remain responsible for verifying the findings of an investigation.
Definitions that humans and AI share
A self-service telemetry platform lets development teams use common instrumentation and conventions with little work. You can provide the same distributed artifacts and definitions to AI agents as well.
A developer who just joined the team and an AI agent both lack the team’s tacit knowledge. If you record decisions as an SDK distribution, a Collector configuration, and semantic conventions, humans and AI agents can refer to the same definitions. The attributes and search paths that an AI agent uses in a late-night incident investigation are also things that the observability platform manages.
The idea of raising autonomy step by step appears in several fields. Examples are SAE J3016 for automated driving (levels 0 to 5) and the levels of autonomy from the Cloud Security Alliance, which build on that idea for agentic AI. Several companies also publish AIOps maturity models. The four levels in this book map these general ideas to the permissions that a telemetry platform actually grants (read, suggest, and act). The number of levels and their names are only my own classification for this book. When you use them in your organization, define them again to match your own permission boundaries. ↩︎