# Introduction
> Source: https://www.ymotongpoo.com/books/observability-platform-with-otel/00-introduction/
Imagine that you open a trace in the middle of an incident. The spans connect from the frontend to the order service, but the trace stops at the inventory service after it. You ask the inventory team, and they reply, "It should be instrumented." You dig in and find that only that service is missing the setting that passes trace context between services. Its traces have been split for six months. You try to filter the dashboard by environment, and three values appear side by side: `production`, `prod`, and `prd`.
The cause is not one lazy team. Each team made its own decisions when it instrumented its service. [OpenTelemetry](https://opentelemetry.io/docs/) standardized the format of telemetry and the way to transport it. Each organization still has to design how it distributes instrumentation internally and how it keeps attributes consistent. This book treats that design as Platform Engineering for observability.
{{< message alert >}}
**Many of the features in this book are not stable yet**
This book aims to show the direction in which OpenTelemetry is heading. For that reason, it also covers areas where the specifications and tools are not settled. As of September 2026, OpAMP Supervisor is alpha, and Weaver is pre-1.0 (v0.26.1). All GenAI semantic conventions are at the Development stage. The Go implementation of declarative configuration (otelconf) and Consistent Probability Sampling are experimental.
These areas will get more breaking changes. Attribute names will change, command arguments will change, and default values will change too. Do not apply the code examples or configurations in this book to production as they are. Check the current specification in the documentation for the version that you adopt. For each feature, the text gives its stability together with the date on which I checked it.
The central idea of this book does not depend on the version of any tool: move the decisions that the organization shares into executable defaults, distributed artifacts, and checks. You can evaluate this design while you wait for stable releases.
{{< /message >}}
## The limits of the centralized model
The usual first move is to create a central team that knows observability well. That team takes over instrumentation reviews, Collector configuration changes, and naming questions.
This model works while the organization is small. But the capacity of the central team stays the same, and the requests grow with the number of teams and services. To avoid waiting for reviews, teams start to use their own configurations. The central team exists to make things uniform, and now it causes more inconsistency. Tighter control makes the wait longer. Looser control loses consistency.
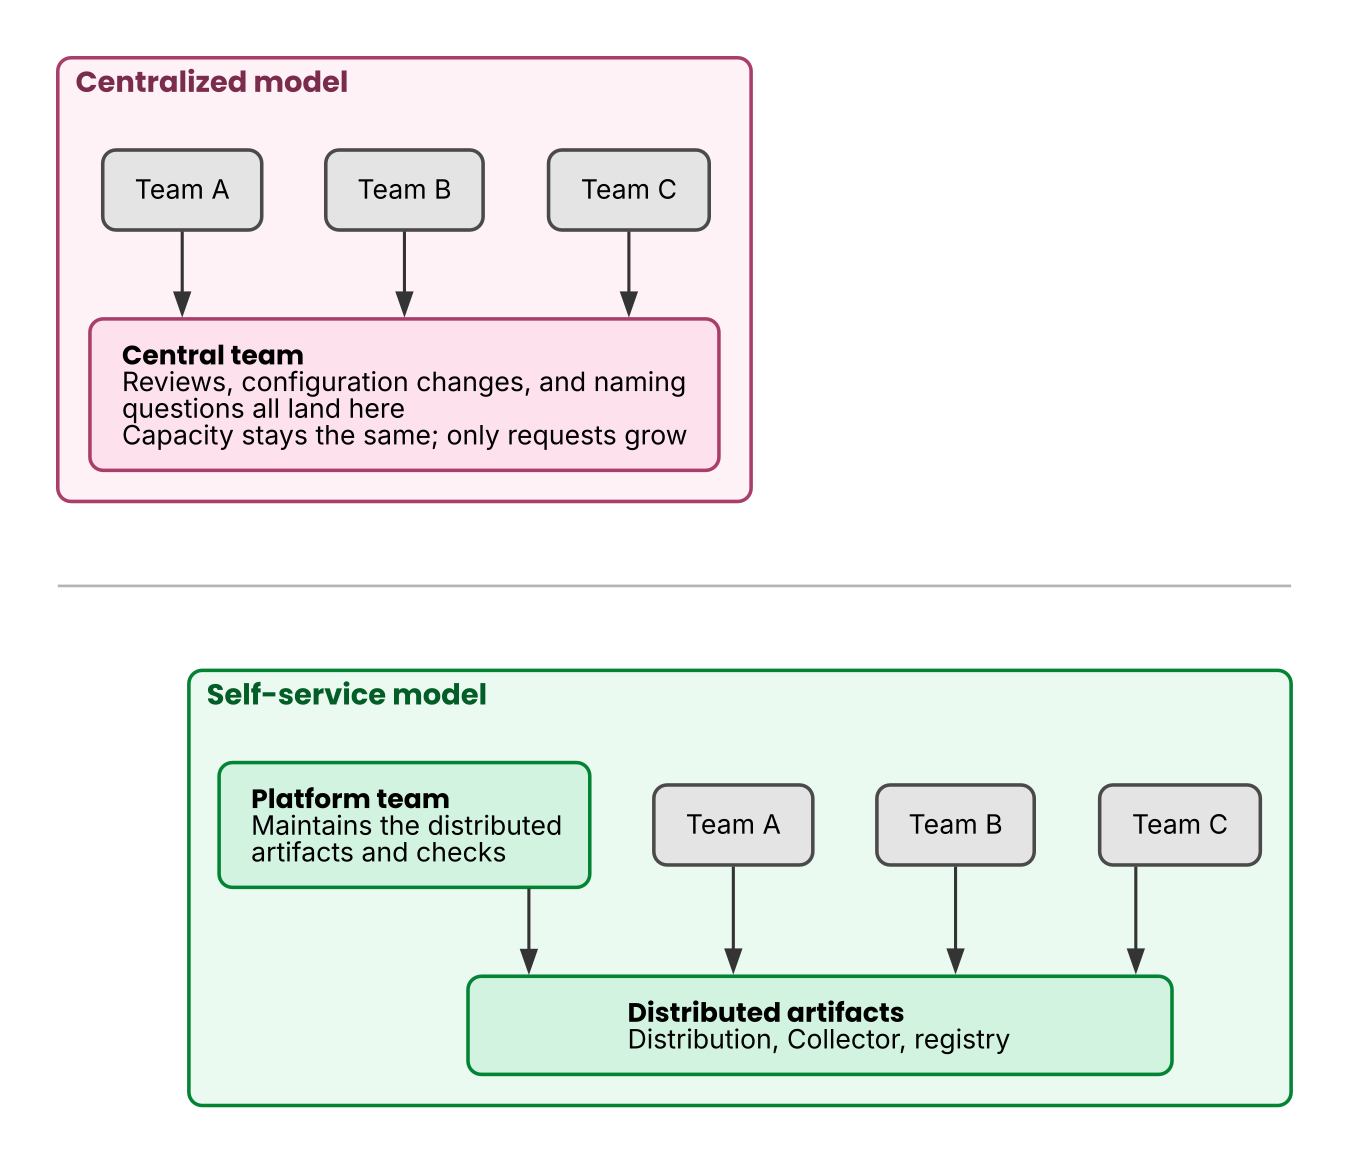
*Figure 1: The arrows point to where each request goes. In the centralized model, requests pile up at the central team. In the self-service model, each team uses what the platform team distributes, so the queue of individual requests gets shorter.*
## The idea of self-service
Platform Engineering changes the job of the platform team. The team stops processing individual requests. Instead, it provides a system with which each team can configure things correctly on its own. This book calls this way of providing the platform **self-service**.
To get there, you move the ownership of telemetry from the central team to the development teams that own the services. The development teams decide what to instrument, and they use that telemetry in operations.
However, if you hand all instrumentation and configuration to the development teams, you hand over the cognitive load as well. How to initialize the SDK, how to configure the Collector, and how to name attributes are decisions that many teams share. The platform team prepares the defaults and distributed artifacts for these decisions, so that teams can adopt the standard configuration with little work. Teams can deviate from the standard, but a team that deviates takes on the design and operation that the deviation needs. This is the idea of a **golden path**[^teamtopologies].
[^teamtopologies]: The relationship between the teams matches the relationship between a platform team and stream-aligned teams in [Team Topologies](https://teamtopologies.com/) ([Japanese edition](https://amzn.to/4rhgFAt)). The purpose of a platform team is to reduce the cognitive load of each development team.
The self-service in the title of this book describes a state with two properties. Development teams can set up observability for their own services without waiting for a central team. And the organization as a whole ends up with consistent results.
## The minimum OpenTelemetry setup
This book does not assume that you have implemented anything with OpenTelemetry. The discussion needs only the path that telemetry takes from the moment it is created until it is stored.
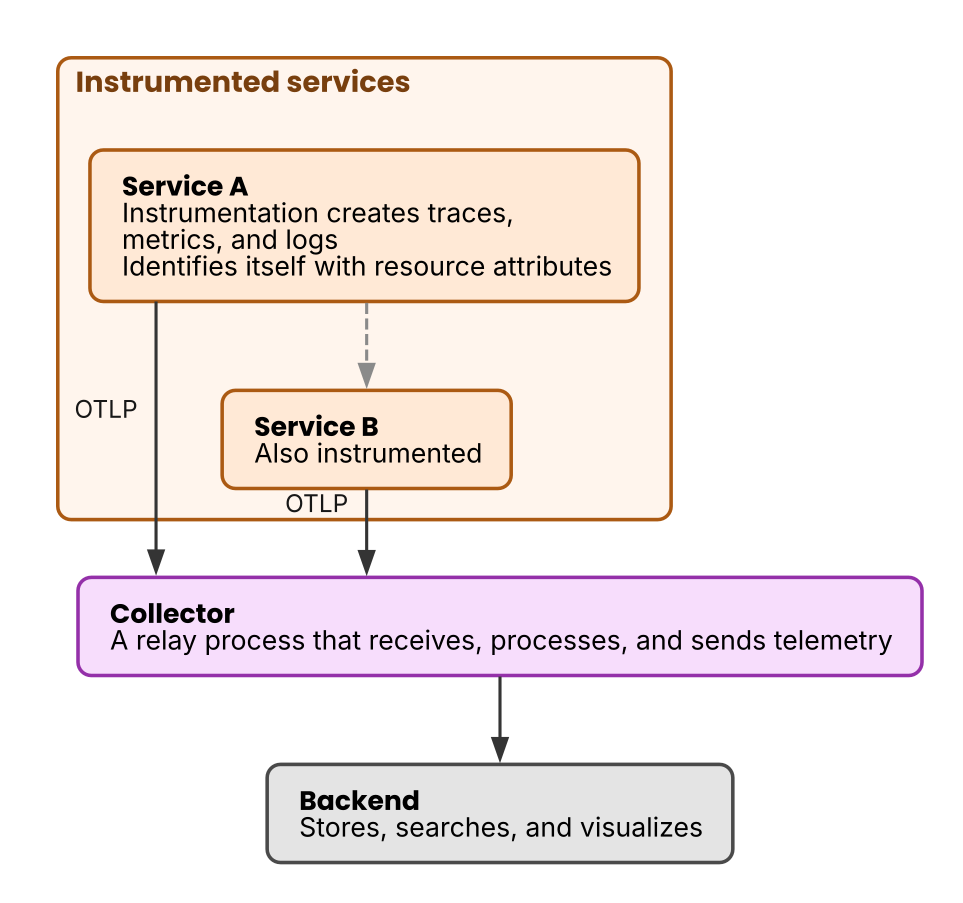
*Figure 2: Solid arrows show the flow of telemetry, and dotted arrows show requests between services. Each request carries the trace context. The telemetry that an instrumented service creates travels over OTLP through the Collector to the backend.*
**Instrumentation** is the mechanism that makes an application generate telemetry. The main kinds of telemetry are **traces**, which record how a request is processed, **metrics**, which record how numbers change over time, and **logs**, which record events during processing.
The unit that makes up a trace is the **span**. One span records the start time, the end time, and the attributes of one unit of work, such as processing in a service or an outgoing call. Each span links to the span of its caller as its parent, and together the spans form one trace. In the opening scene, the following chain broke just before the inventory service.
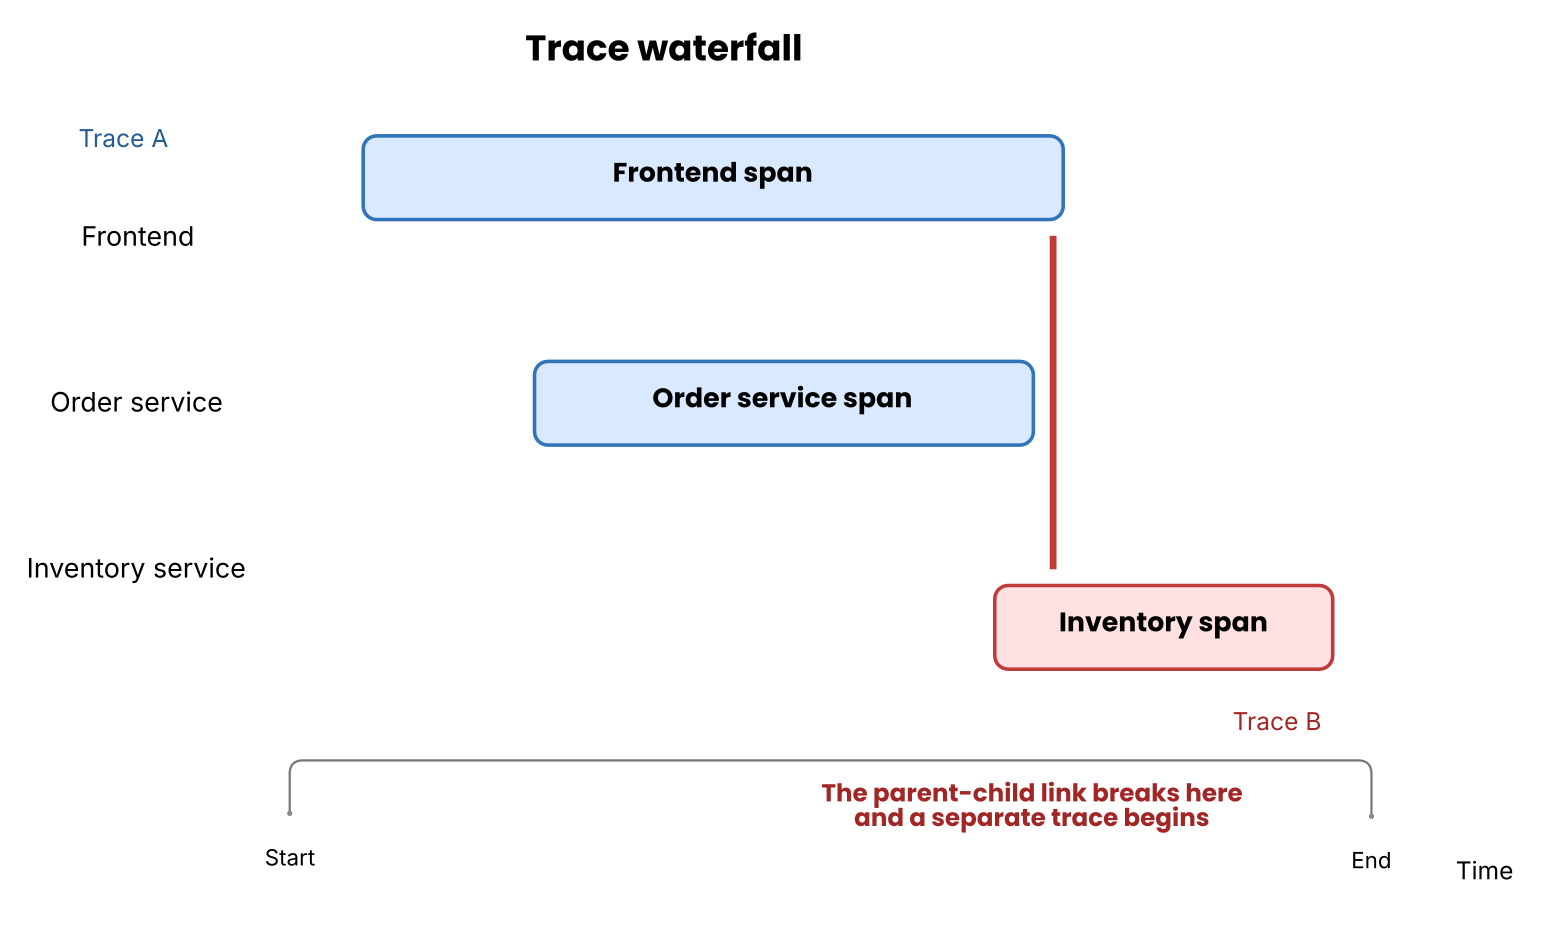
*Figure 3: The spans from the frontend to the order service connect as trace A. Only the span of the inventory service splits off into trace B, and the parent-child relationship breaks.*
Each service sends its own spans, and the storage side assembles the trace from the parent-child relationships. Telemetry carries **resource attributes**, which describe its source. `service.name`, which holds the service name, and the environment identifier are resource attributes too.
The component that sends telemetry out is the **exporter**. The exporter sends telemetry with a standard protocol called OTLP. The telemetry passes through a relay process called the Collector and reaches the backend, which stores and visualizes it.
The dotted arrows in Figure 2 show the communication that relates to the split trace in the opening scene. In distributed tracing, when service A calls service B, service A puts the context that identifies the current trace on the request. The component that handles this handoff is the **propagator**. A service without a configured propagator cannot inherit the parent-child relationship, and it records its spans as a separate trace.
This book does not explain how to use individual APIs. The following chapters explain the structure of the platform through one question: which part of the path from instrumentation to storage does each change affect?
## The three pillars of the platform
I divide the platform for self-service into three pillars, all built on OpenTelemetry.
The first pillar is distributing instrumentation. The platform distributes a preconfigured internal SDK distribution, which reduces the initialization code that development teams write (Chapter 2). For services whose code nobody can change, zero-code instrumentation generates a minimum set of telemetry (Chapter 3).
The second pillar is managing the OpenTelemetry Collector layer. The decisions about how to transport telemetry move out of the applications. The platform distributes a custom-built Collector and predefined configurations (Chapter 4). Once the number of Collectors and configuration changes grows, the platform distributes configurations with OpAMP (Chapter 5).
The third pillar is the governance of semantic conventions. The platform defines the names and meanings of attributes in a registry. OpenTelemetry Weaver then automates the checks, the code generation, and the comparison with real telemetry (Chapter 6). With this, you can detect inconsistent spellings such as `prod` and `production` from the opening scene.
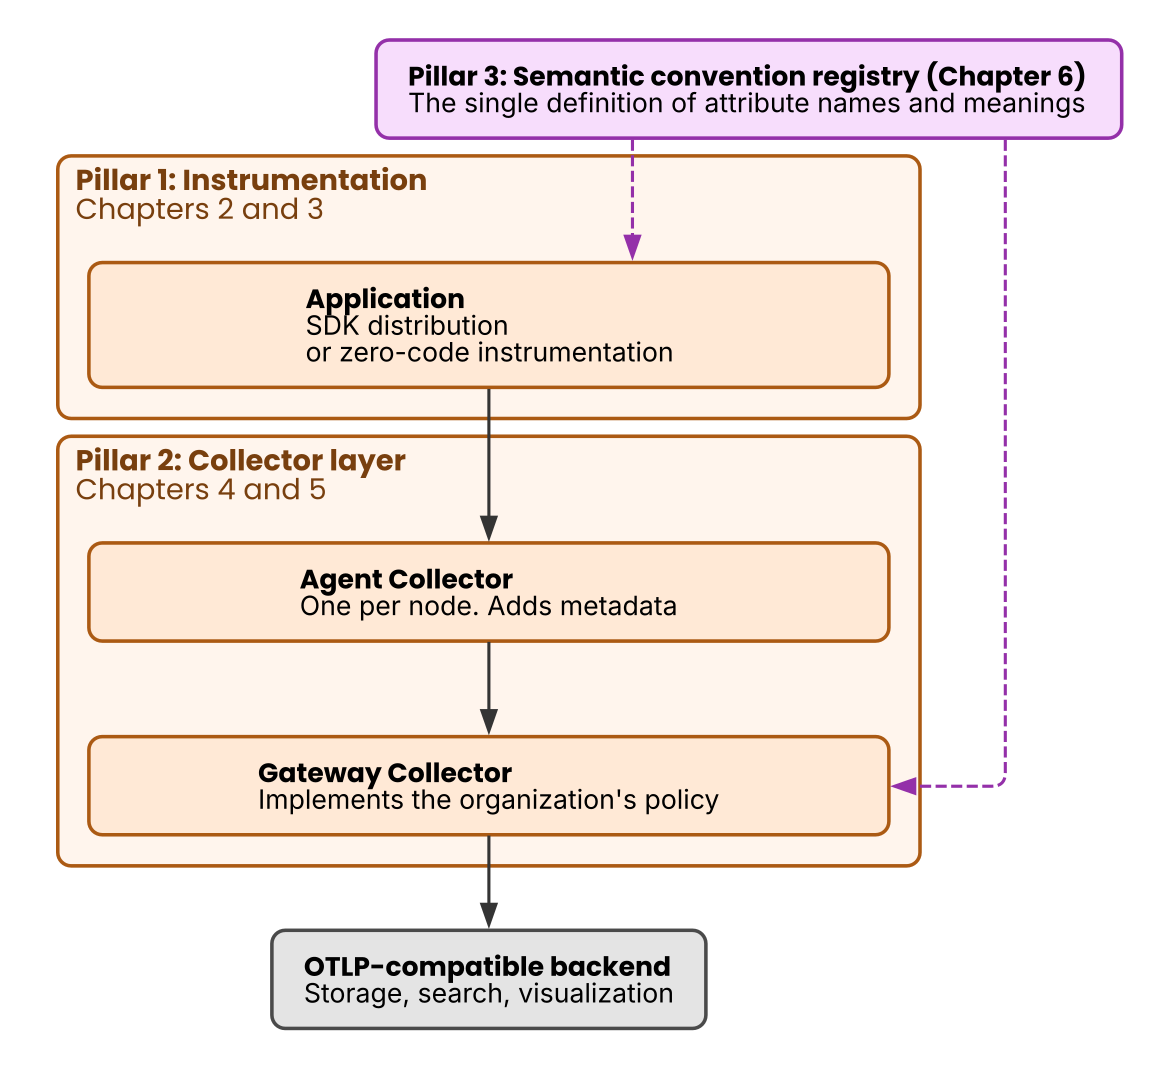
*Figure 4: Solid arrows show the flow of telemetry, and dotted arrows show where the artifacts generated from the registry go. The figure shows which part of the path from instrumentation to storage each of the three pillars changes.*
A self-service design states clearly who decides what. The following table lists four things for each pillar: what the platform distributes, what the development teams decide, what the platform enforces, and how a team deviates from the standard configuration. Each chapter explains the terms in the table, so for now look only at its overall shape.
| Pillar | What the platform distributes | What development teams decide | What the platform enforces | How to deviate |
|---|---|---|---|---|
| Instrumentation | • SDK distribution
• Zero-code instrumentation
• Defaults | • Business spans and attributes
• Optional data to record | • Minimum resource attributes
• Propagation of trace context | • Standard environment variables
• Explicit configuration |
| Collector | • Binary
• Pipelines
• Update path | • Extra requirements within the allowed scope | • Authentication
• Removal of personal and sensitive information
• Capacity control | • A separate extra pipeline
• A separate Collector |
| Conventions | • Registry
• Generated artifacts
• Checks | • Meaning of domain attributes | • Namespaces
• Types
• Compatibility | • A change PR to the registry |
The three pillars depend on each other. The distribution bundles attribute constants generated from the registry, and the Collector processes data in transit against the conventions. A change to the registry reaches each environment through the distribution paths for the SDK distribution and the Collector configuration. Platform Engineering designs the pillars together with these dependencies.
## Designing for AI agents
On a platform that brings AI agents into development and operations, AI agents read and write telemetry alongside humans.
On the writing side, workloads that use LLMs generate new kinds of telemetry, such as token usage and the structure of conversations. OpenTelemetry has GenAI conventions for this purpose (Chapter 7). On the reading side, AI agents search telemetry and take part in incident investigation and operations (Chapter 8).
This book puts forward a hypothesis. If you govern the schema and make it machine-readable, AI agents are less likely to generate wrong queries. A human can guess from context when attribute names are inconsistent. An AI agent, by contrast, runs the query that it generated, and it may not notice the data that the search missed. Chapter 8 explains this mechanism and the method to verify it separately.
If the hypothesis holds, your investment in the three pillars also prepares the way for AI agents to take part in operations. However, you still need to measure its effect on investigation accuracy.
## How this book is organized and how to read it
This book is the companion to my [Platform Engineering Kaigi 2026 session](https://www.cnia.io/pek2026/sessions/eba4a57f-e4f0-4201-b731-0a37d6a53f7a/) "Building a Self-Service Observability Platform with OpenTelemetry" (in Japanese). It contains the design details that the session leaves out and a reference implementation that you can run on your own machine (Chapter 9).
The intended readers are Platform Engineers, architects, and engineering managers who provide an observability platform to their organization. The book does not assume experience with implementing OpenTelemetry. Most code examples use Go, but the design points apply to other languages. Where a multi-language rollout creates differences, the relevant section explains them.
## The environment this book assumes
To show a concrete design, this book assumes the environment below. In later chapters, some passages say, "This is a decision based on this book's assumptions." Those passages mark a choice that I made under these assumptions. Neither the OpenTelemetry specification nor a community consensus fixes that choice. Under different assumptions, a different choice can be correct.
- **Several teams develop and operate their own services independently.** The central team has no permission to change the code of each service
- **Most services run on Kubernetes.** However, some services still run on VMs or elsewhere outside Kubernetes
- **The organization manages where telemetry goes.** Someone central must decide on backend contracts, cost, retention periods, and access permissions
- **The platform team is small compared with the number of services.** An approach that handles requests one by one cannot keep up
If the first of these four assumptions does not hold, that is, if a single team owns all the services, many mechanisms in this book are overkill. Managing the configuration in one place is enough.
{{< message >}}
This book is based on information as of September 16, 2026. The stability stages are as the notice at the start of this chapter describes, and the text gives the stage of each feature as of the date I checked it. I use the OSS Grafana stack (Grafana, Tempo, Loki, and Mimir) to test the setup. The design from instrumentation to sending OTLP does not depend on a specific backend. But searching after storage, correlating signals, and searching from AI agents all differ from backend to backend. The text calls out every backend-specific part.
{{< /message >}}