First published: Last updated:
Running OBI and Viewing the Result in Grafana
Originally published in Japanese at https://zenn.dev/ymotongpoo/books/go-ebpf-primer/viewer/37-handson.
The previous chapter covered OBI’s origins and its pipeline. Now you run it. You let OBI instrument two HTTP services written in Go, and you view the resulting traces and metrics in Grafana. You change no line of the application source, and you add no OpenTelemetry SDK. The four hurdles of Chapters 10 through 13 are the story of how OBI produces each thing you see here.
What you need
OBI runs only on Linux. It needs a kernel of version 5.8 or later with BTF enabled, a CPU of amd64 or arm64, and the permission to load eBPF programs. If you have Docker and Docker Compose, you need nothing else.
To try the context propagation of Hurdle 4, one more condition applies. Kernel lockdown mode must be off. The SUPPORT_MATRIX.md in the OBI repository states the condition this way.
On Linux 5.10 and later, OBI requires effective
CAP_SYS_ADMINand kernel lockdown mode[none]to usebpf_probe_write_user.
Check your own machine with the following command.
$ cat /sys/kernel/security/lockdown
[none] integrity confidentiality
The brackets around [none] mean that you can use it. On a machine with Secure Boot enabled, the value is sometimes [integrity], which closes the path that OBI uses to write into the application’s memory. You see what that closes off later in this chapter, after you have run everything.
The Go applications to instrument
You build two of them, frontend and backend. When frontend receives /order, it calls /inventory on backend and returns the result.
package main

import (
	"encoding/json"
	"io"
	"log"
	"net/http"
	"os"
)

func main() {
	backend := os.Getenv("BACKEND_URL")

	http.HandleFunc("/health", func(w http.ResponseWriter, _ *http.Request) {
		io.WriteString(w, "ok\n")
	})

	http.HandleFunc("/order", func(w http.ResponseWriter, _ *http.Request) {
		resp, err := http.Get(backend + "/inventory")
		if err != nil {
			http.Error(w, err.Error(), http.StatusBadGateway)
			return
		}
		defer resp.Body.Close()

		body, err := io.ReadAll(resp.Body)
		if err != nil || resp.StatusCode != http.StatusOK {
			http.Error(w, "inventory lookup failed", http.StatusBadGateway)
			return
		}

		w.Header().Set("Content-Type", "application/json")
		json.NewEncoder(w).Encode(map[string]any{
			"order":     "accepted",
			"inventory": json.RawMessage(body),
		})
	})

	log.Fatal(http.ListenAndServe(":8080", nil))
}
backend pretends to look up inventory. It sleeps for a few tens of milliseconds, and it returns a 500 once in every ten requests. That spread in duration and error rate makes the metrics move when you look at them later. It also copies the Traceparent header of the request it received straight into the response. Neither frontend nor backend sets that header itself.
package main

import (
	"encoding/json"
	"log"
	"math/rand"
	"net/http"
	"time"
)

func main() {
	http.HandleFunc("/inventory", func(w http.ResponseWriter, r *http.Request) {
		time.Sleep(time.Duration(20+rand.Intn(80)) * time.Millisecond)

		if rand.Intn(10) == 0 {
			http.Error(w, "inventory unavailable", http.StatusInternalServerError)
			return
		}

		w.Header().Set("Content-Type", "application/json")
		json.NewEncoder(w).Encode(map[string]any{
			"sku":         "sku-42",
			"stock":       7,
			"traceparent": r.Header.Get("Traceparent"),
		})
	})

	log.Fatal(http.ListenAndServe(":8081", nil))
}
Neither go.mod requires anything outside the standard library.
module example.com/frontend

go 1.26
The two Dockerfiles have the same shape. The one for frontend follows. For backend, replace the word frontend in four places.
FROM cgr.dev/chainguard/go:latest AS build
WORKDIR /src
COPY go.mod main.go ./
RUN CGO_ENABLED=0 go build -o /out/frontend .

FROM cgr.dev/chainguard/static:latest
COPY --from=build /out/frontend /frontend
ENTRYPOINT ["/frontend"]
I used the Chainguard go image for the build. The public catalog offers only the latest tag, so pin a digest when you need a fixed version. That latest is Go 1.27.1 today.
I left out -ldflags="-s -w" on purpose. Chapter 14 covers what happens when you add it.
Building the compose file
The telemetry goes to grafana/otel-lgtm. One image holds Grafana, Prometheus, Tempo, Loki, Pyroscope, and an OpenTelemetry Collector, and it starts with no configuration file. This chapter uses four of them: Grafana, Prometheus, Tempo, and the Collector. OBI only has to send OTLP to it.
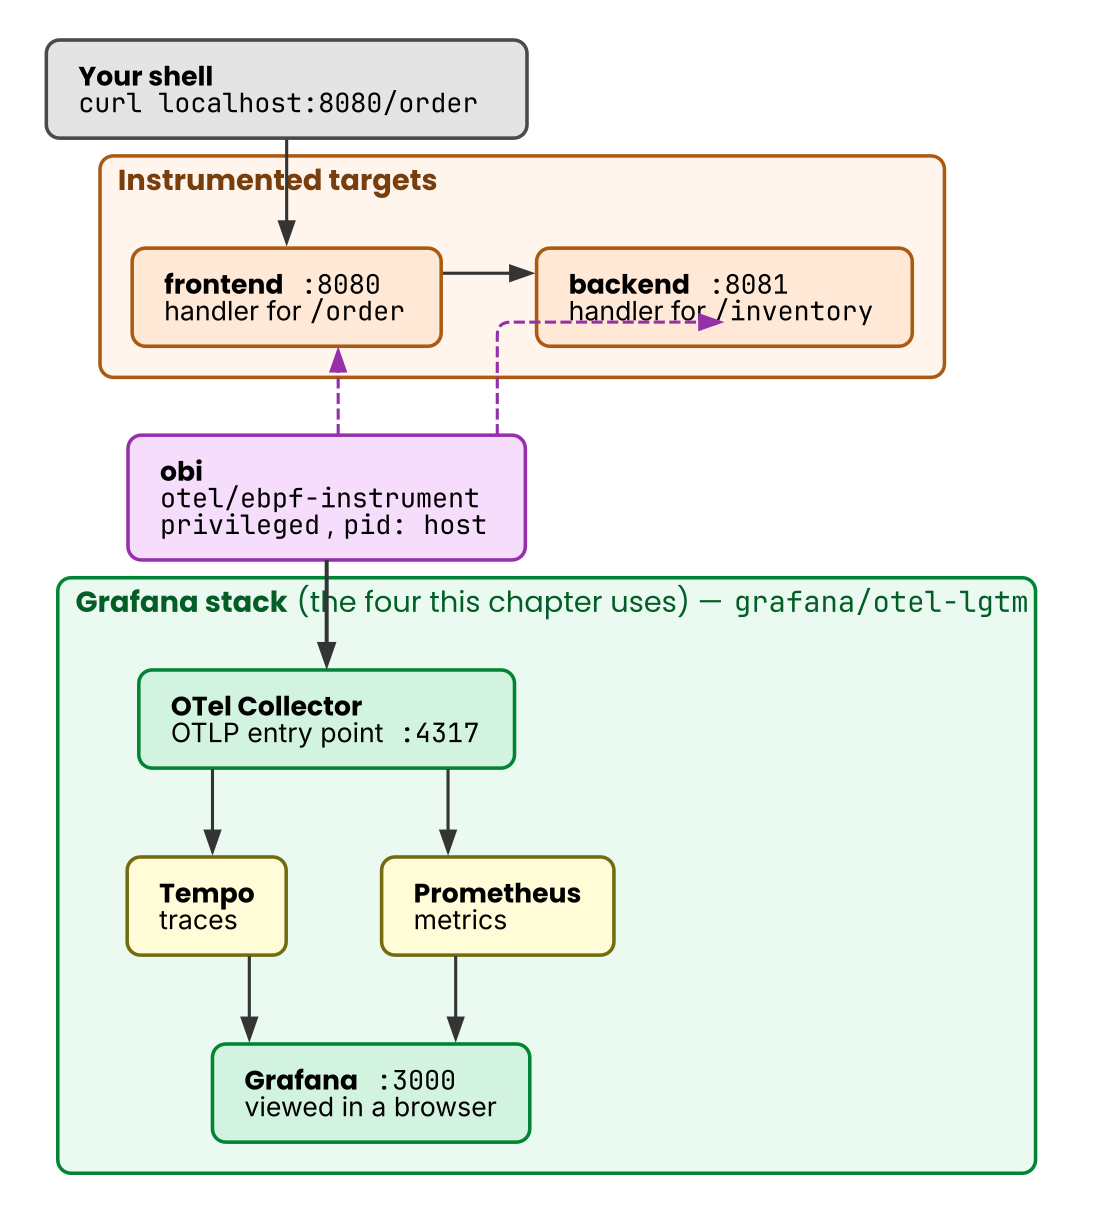 Figure 1: Solid arrows represent the flow of requests and telemetry; dashed ones show OBI observing the targets and writing into them. OBI watches each of the two services directly. It sees the host process space through
 pid: host, so nothing goes into the application containers. The four parts of the Grafana stack that this chapter uses live inside the single grafana/otel-lgtm container.
services:
  frontend:
    build: ./frontend
    environment:
      OTEL_SERVICE_NAME: frontend
      BACKEND_URL: http://backend:8081
    ports:
      - "8080:8080"

  backend:
    build: ./backend
    environment:
      OTEL_SERVICE_NAME: backend

  obi:
    image: otel/ebpf-instrument:v0.13.0
    privileged: true
    pid: host
    environment:
      OTEL_EBPF_AUTO_TARGET_EXE: "/{frontend,backend}"
      OTEL_EBPF_TRACE_PRINTER: text
      OTEL_EBPF_BPF_CONTEXT_PROPAGATION: disabled
      OTEL_EBPF_METRICS_FEATURES: application
      OTEL_EBPF_METRICS_INTERVAL: 15s
      OTEL_EXPORTER_OTLP_ENDPOINT: http://lgtm:4317
      OTEL_EXPORTER_OTLP_PROTOCOL: grpc
    volumes:
      - /sys/kernel/security:/sys/kernel/security:ro
      - /sys/fs/bpf:/sys/fs/bpf:rw
    depends_on: [frontend, backend, lgtm]

  lgtm:
    image: grafana/otel-lgtm:0.32.1
    ports:
      - "3000:3000"
This setup needs both privileged: true and pid: host. The first hands over, in one move, the permissions that loading eBPF programs requires. The second makes the host’s processes visible. privileged is a choice for convenience. In production you can grant only the permissions you need, such as CAP_BPF and CAP_PERFMON; the permissions documentation covers the detail.
The two mounted paths each have a job. OBI reads the lockdown state through /sys/kernel/security, and it pins eBPF maps under /sys/fs/bpf. Without /sys/fs/bpf, OBI logs a warning and disables the features that depend on pinned maps.
OBI takes seven environment variables here, and two of them are standard OpenTelemetry variables. The configuration reference has the full list.
| Environment variable | Meaning |
|---|---|
OTEL_EBPF_AUTO_TARGET_EXE | Selects the targets with a glob over the executable path |
OTEL_EBPF_TRACE_PRINTER | Prints the captured spans to standard output. The default is disabled |
OTEL_EBPF_BPF_CONTEXT_PROPAGATION | Context propagation, the subject of Hurdle 4. The default is disabled, and you choose from headers, tcp, and all |
OTEL_EBPF_METRICS_FEATURES | Which metrics to emit. application gives HTTP and gRPC request counts, errors, and durations |
OTEL_EBPF_METRICS_INTERVAL | How often to send metrics. The default is 60 seconds |
OTEL_EXPORTER_OTLP_ENDPOINT | Where to send |
OTEL_EXPORTER_OTLP_PROTOCOL | The protocol that carries the data. gRPC here |
OTEL_SERVICE_NAME sits on the instrumented containers because OBI reads the service name from the target process’s environment. The side that gets observed sets it, not OBI.
The braces in the target glob group several paths into one pattern. Each image holds a single executable in an image close to scratch, so the paths are /frontend and /backend.
You can also select targets by port number with OTEL_EBPF_OPEN_PORT. Port 8080 is published to the host, though, so the application process is not the only one holding it open. Docker’s docker-proxy, which forwards the port, matches the same condition and joins the instrumented set. That is why I select by executable path.
Signs that instrumentation started
Start everything with docker compose up -d --build. The build, and OBI’s discovery of the targets, take a few seconds, so look at OBI’s log first. --no-log-prefix drops the container name from the start of each line. Every log below also has its leading timestamp removed.
$ docker compose logs --no-log-prefix obi
level=INFO msg="OpenTelemetry eBPF Instrumentation" Version=v0.13.0 Revision=3cc1986 "OpenTelemetry SDK Version"=1.46.0
level=INFO msg="configuration loaded" version=v1
level=WARN msg="timed out while waiting for Cloud metadata. Ignoring" component=meta.NodeMeta.otelNodeFetcher detector=azurevm.ResourceDetector
level=WARN msg="timed out while waiting for Cloud metadata. Ignoring" component=meta.NodeMeta.otelNodeFetcher detector=ec2.resourceDetector
level=INFO msg="starting Application Observability mode"
level=INFO msg="using hostname" component=traces.ReadDecorator function=instance_ID_hostNamePIDDecorator hostname=edb90d2694f5
level=INFO msg="using hostname" component=traces.ReadDecorator function=instance_ID_hostNamePIDDecorator hostname=edb90d2694f5
level=INFO msg="Starting main node" component=obi.Instrumenter
level=INFO msg="instrumenting process" component=discover.traceAttacher cmd=/backend pid=74712 ino=2261228 type=go service=backend logenricher=false
level=INFO msg="instrumenting process" component=discover.traceAttacher cmd=/frontend pid=74719 ino=2261238 type=go service=frontend logenricher=false
The two warnings about cloud metadata mean only that this machine sits on neither AWS nor Azure, so the lookup failed. You can ignore them.
The last two lines are the ones to read. instrumenting process marks the end of stages 1 and 2 of the pipeline from Chapter 8. type=go means that OBI parsed the ELF and decided that this binary is a Go binary.
Send one request now, and the Traceparent header that backend received comes back empty.
$ curl -s localhost:8080/order
{"inventory":{"sku":"sku-42","stock":7,"traceparent":""},"order":"accepted"}
After that request goes through, OBI’s log carries the spans that OTEL_EBPF_TRACE_PRINTER printed. I have dropped the contentLen and responseLen columns below.
(83.742346ms[83.678157ms]) HTTP(subType=0) 200 GET /inventory(/inventory) [172.18.0.3 as 172.18.0.3:39986]->[172.18.0.4 as backend:8081] svc=[backend go] traceparent=[00-96b553ab888fe7c26bd049ac81064eea-43d84c631513a950[998c4a1edfbd832f]-01]
(84.319112ms[84.319112ms]) HTTPClient(subType=0) 200 GET /inventory(/inventory) [172.18.0.3 as frontend:39986]->[172.18.0.4 as backend:8081:8081] svc=[frontend go] traceparent=[00-96b553ab888fe7c26bd049ac81064eea-998c4a1edfbd832f[f8198df6160ef2f4]-01]
(84.978321ms[84.928271ms]) HTTP(subType=0) 200 GET /order(/order) [172.18.0.1 as 172.18.0.1:57560]->[172.18.0.3 as frontend:8080] svc=[frontend go] traceparent=[00-96b553ab888fe7c26bd049ac81064eea-f8198df6160ef2f4[0000000000000000]-01]
Only the traceparent=[00-<trace ID>-<span ID>[<parent span ID>]-01] at the end of each line matters. All three lines carry the same trace ID, 96b553ab.... The parent of /order at the bottom is all zeros, which makes it the root span. Its span ID f8198df6160ef2f4 becomes the parent of the HTTPClient in the middle. That span ID, 998c4a1edfbd832f, becomes the parent of backend’s /inventory at the top.
A parent-child relationship across two processes appears, and neither application carries a line of code for it. You rebuilt nothing and you restarted nothing.
The trace that reached Tempo
Open http://localhost:3000. grafana/otel-lgtm ships with its data sources configured, so choosing Tempo in Explore lets you search right away. Type { resource.service.name = "frontend" } into TraceQL and open one of the traces that come back.
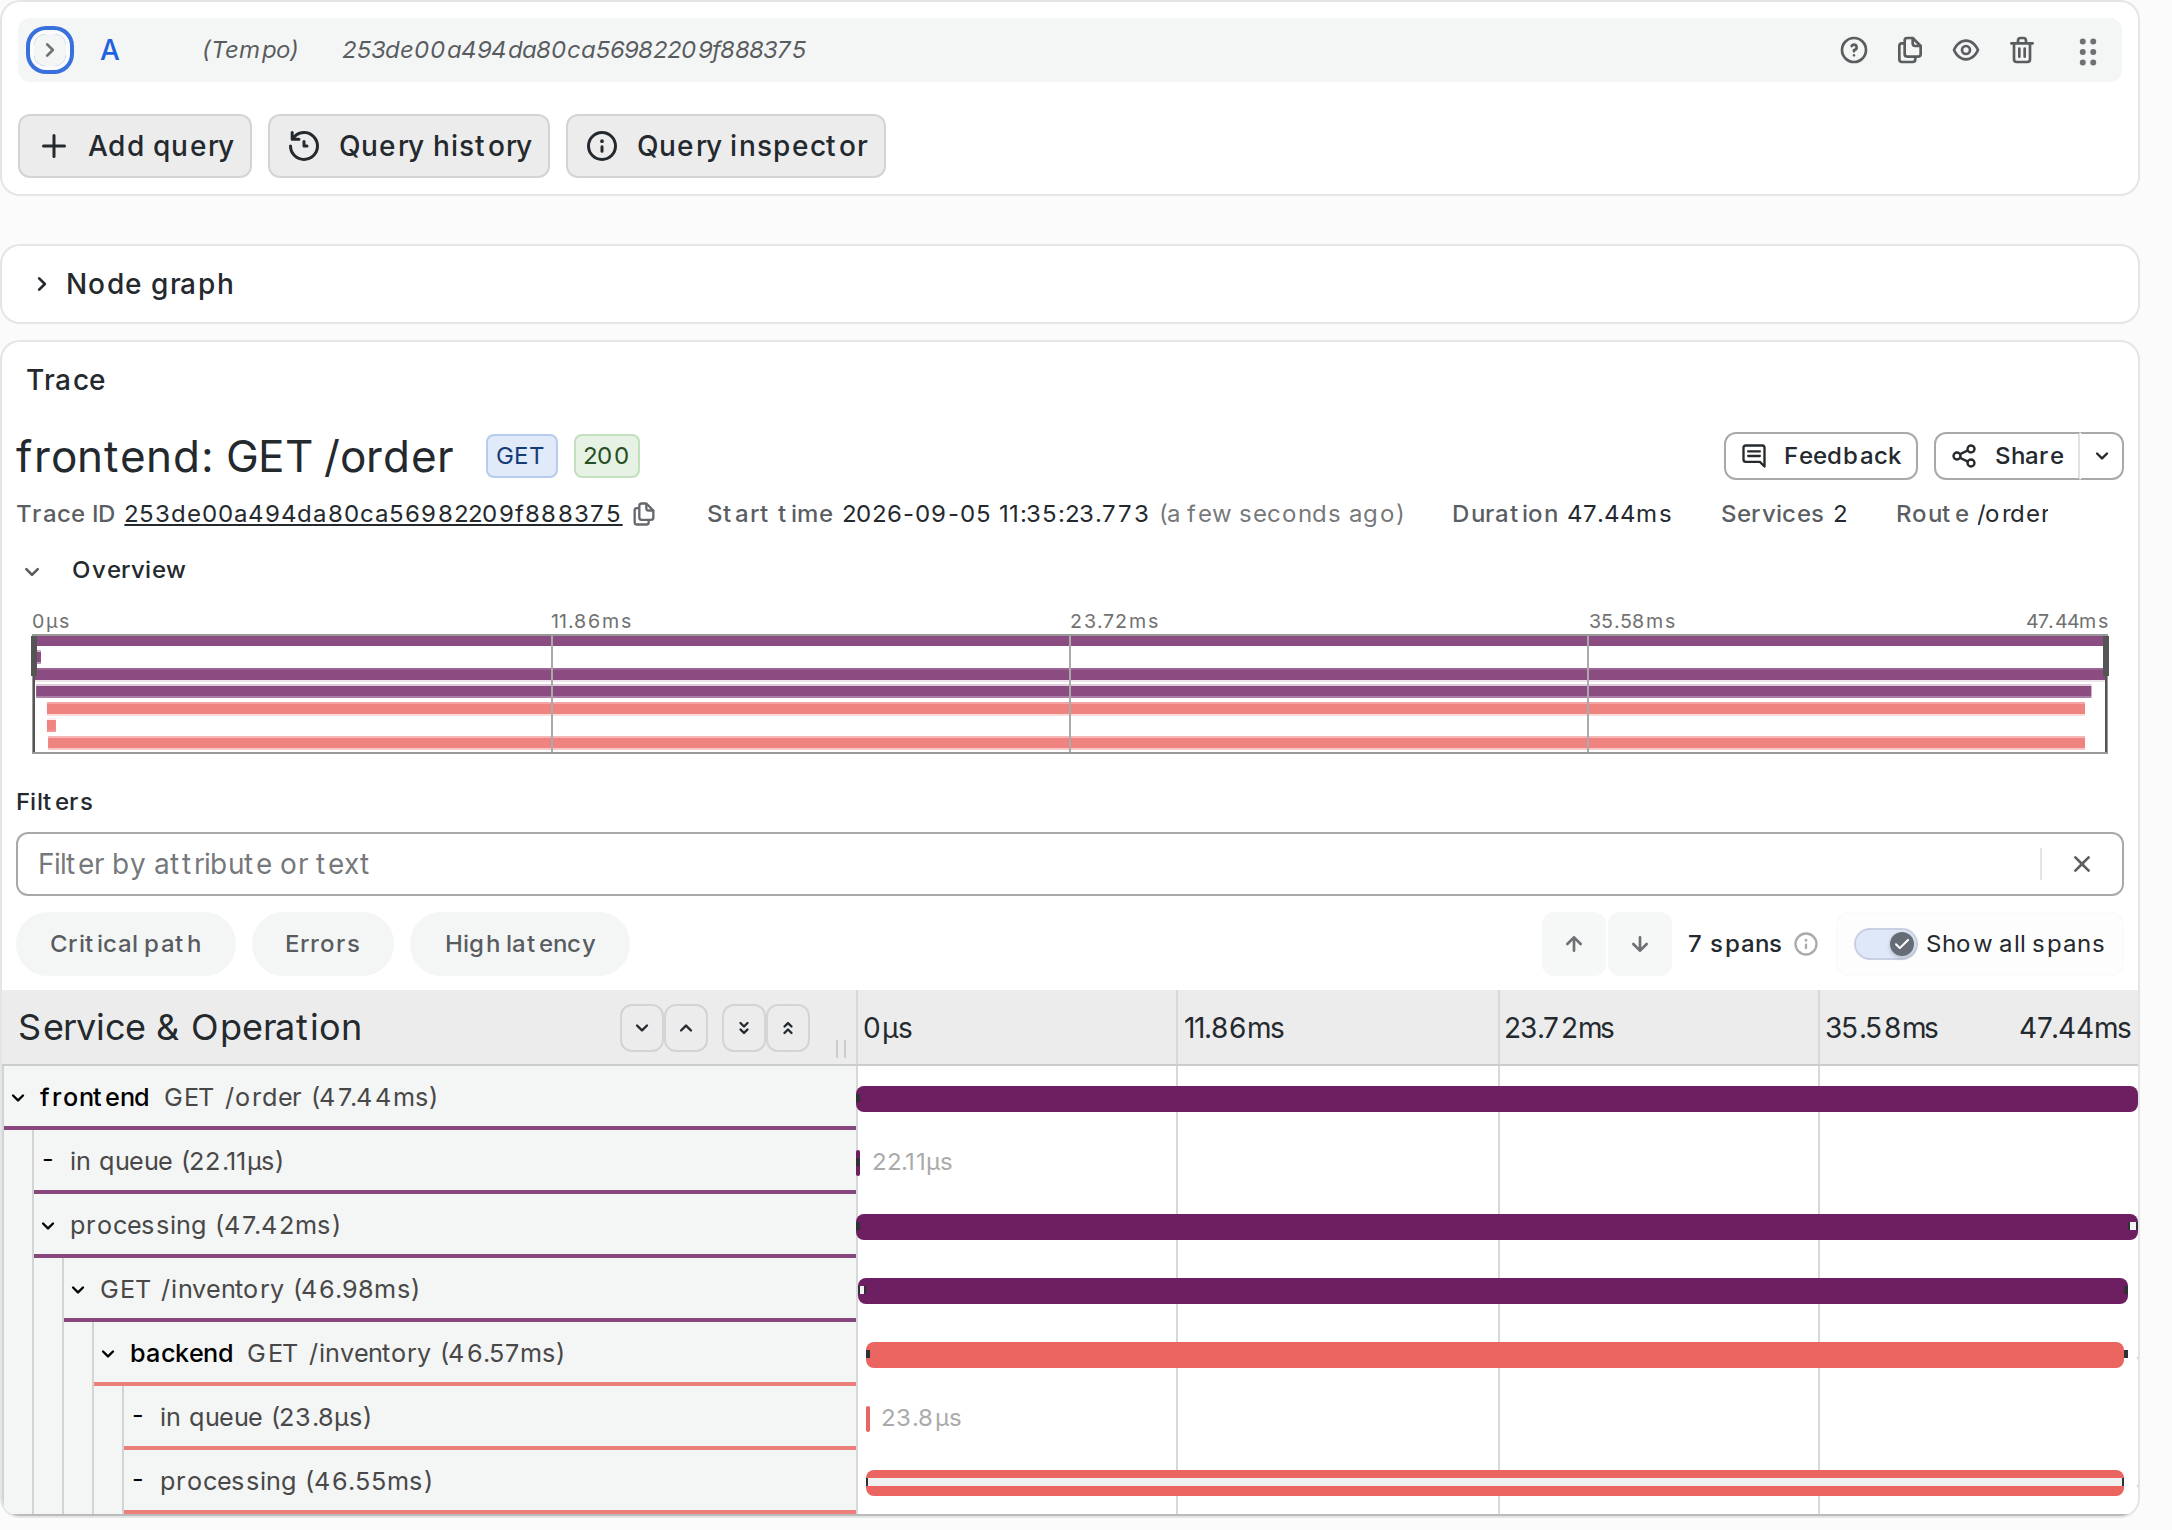 Figure 2: The length of each bar represents the duration of one span. Seven spans form a single trace that covers the two services,
 frontend and backend.
The log showed three spans. Here you see seven. OBI adds in queue and processing for every server span whose wait it could measure. The two split the wait between accepting the request and starting the handler from the time spent inside the handler. Watching only the bytes on a socket cannot draw that line. OBI can draw it because it attaches probes to functions inside net/http.
GET /inventory appears twice. The upper one is the client side in frontend, and the lower one is the server side in backend. The gap between them is the network round trip plus the processing on the client side.
The attributes on the spans matter more in this chapter. The server span in backend carries http.route=/inventory, http.request.method=GET, http.response.status_code=200, server.address=backend, and server.port=8081. The client span in frontend carries url.full=http://backend:8081/inventory.
These values come from more than one place. OBI reads the method and the URL from http.Request. It reads the status code from the struct that writes the response, and the address and the port from the file descriptor of the connection. Every one of them requires knowing where inside a struct that value sits. How OBI learns those positions is Hurdle 3, in Chapter 12.
When OBI writes traceparent
The trace formed a single tree, and yet the Traceparent header that backend received was empty.
$ curl -s localhost:8080/order
{"inventory":{"sku":"sku-42","stock":7,"traceparent":""},"order":"accepted"}
Nothing carrying traceparent crossed the network at that point. The trace connected because one OBI observed both frontend and backend. OBI matches the sends and the receives that it sees, and it rebuilds the parent-child relationship without writing a header.
OBI calls this black-box propagation. The path works only while the other side stays inside the same OBI’s field of view. It does not reach a service on another host, or a peer instrumented with an SDK.
So change compose.yaml.
OTEL_EBPF_BPF_CONTEXT_PROPAGATION: all
Replace only OBI, then send the same request again.
$ docker compose up -d obi
$ curl -s localhost:8080/order
{"inventory":{"sku":"sku-42","stock":7,"traceparent":"00-5e259659c14e5b49c67b5375b2016329-47f01333666f0e07-01"},"order":"accepted"}
That is the value that backend’s handler read with r.Header.Get("Traceparent"). The frontend code sets that header nowhere. It calls http.Get and does nothing more. The value still arrives at backend. Between the two, OBI rewrote the memory of the frontend process and inserted one line into the buffer just before the send.
The code that writes this string rewrites a private field of bufio.Writer from outside the process1. That is Hurdle 4, in Chapter 13.
RED metrics and the service graph
Traces are not the only thing arriving. The request rate, the error rate, and the duration, known together as the RED metrics, arrive too. They read more clearly under sustained load, so keep the requests coming for a while.
$ while true; do curl -s -o /dev/null localhost:8080/order; sleep 0.25; done
Choose Prometheus in Explore and run this query.
sum by (service_name, http_route, http_response_status_code) (rate(http_server_request_duration_seconds_count[1m]))
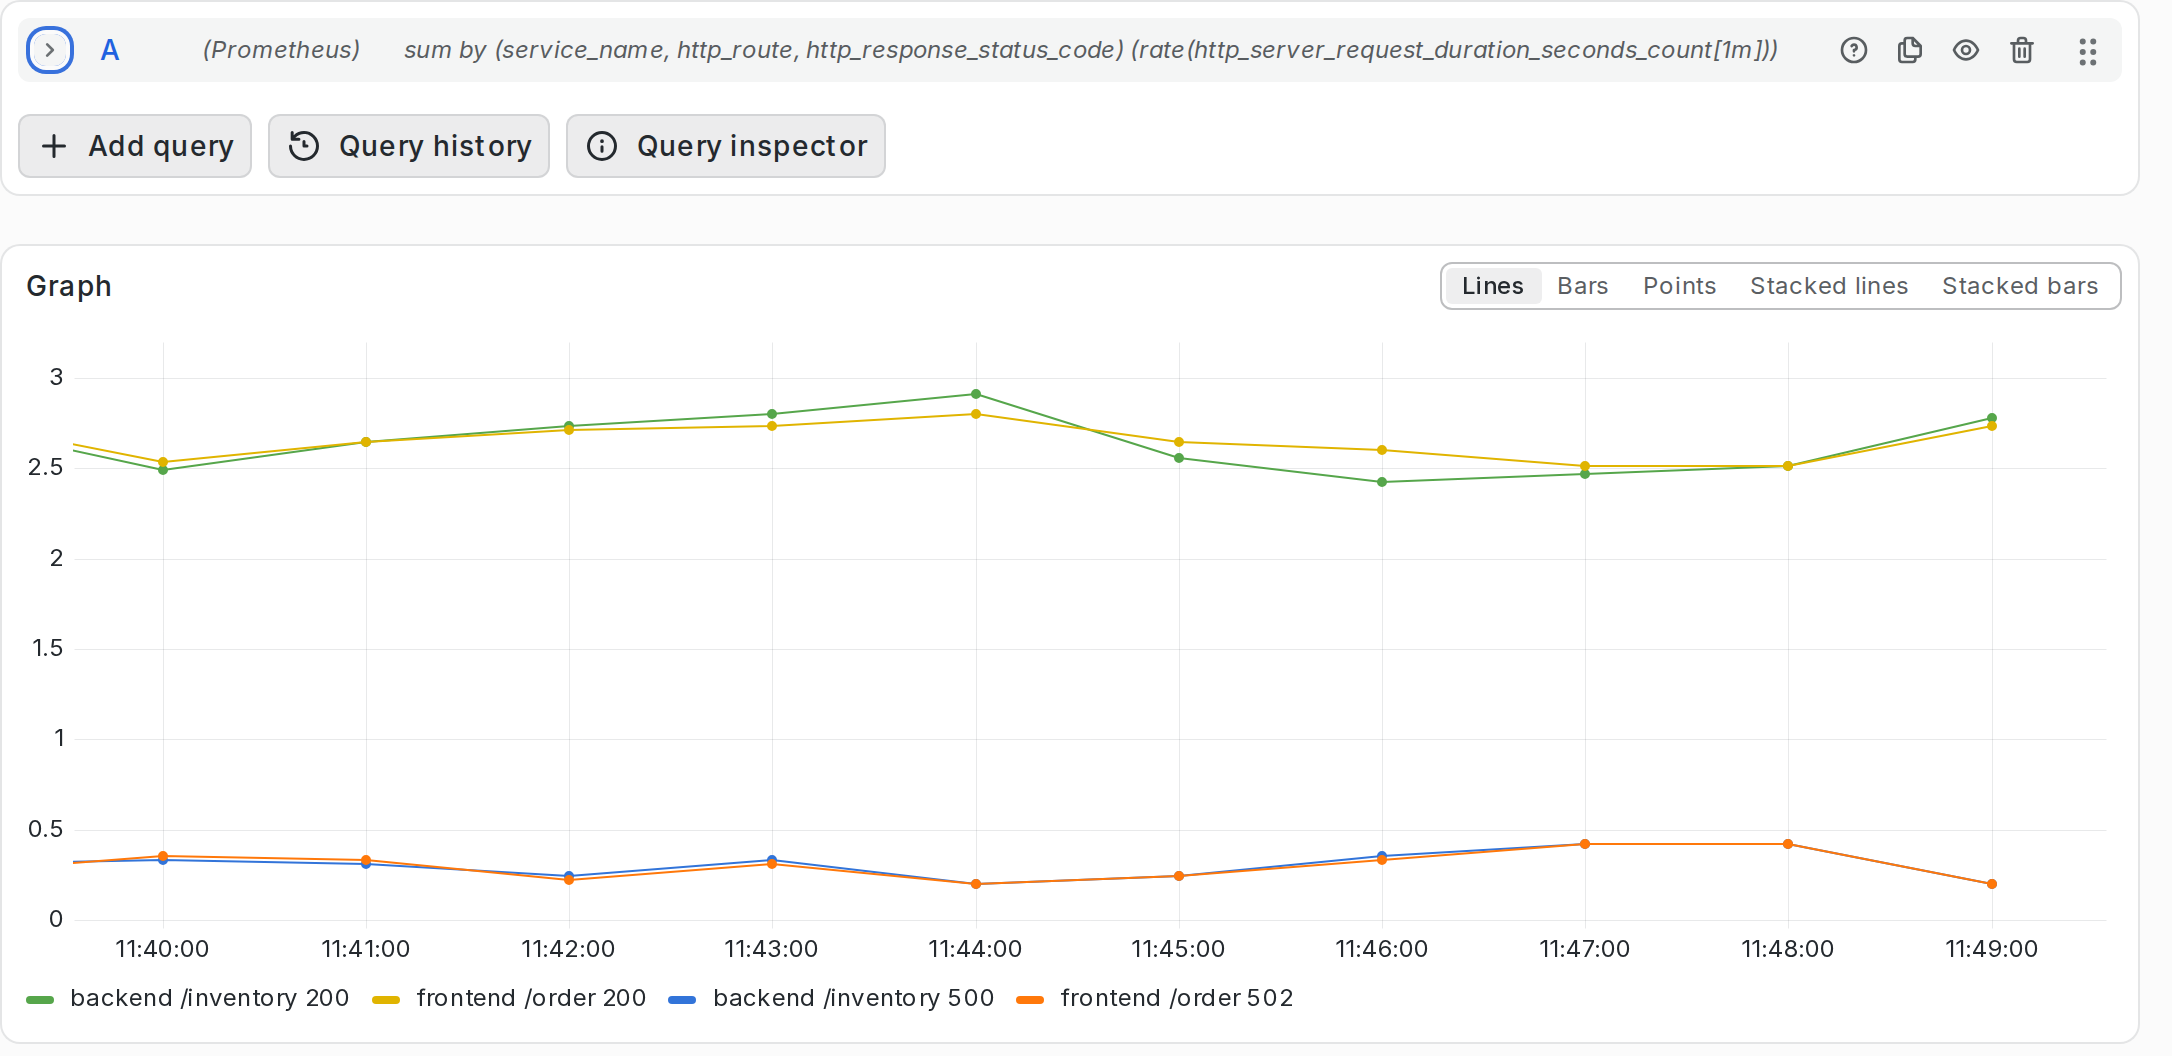 Figure 3: The vertical axis represents requests per second. Each series is one combination of service name, route, and status code.
The 500 that backend returns once in every ten requests, and the 502 that frontend returns in response, appear as separate series. The line for frontend almost covers the line for backend, because each /order calls /inventory exactly once.
The label is http_route, not the path itself. Using the URL path as a label would grow the series count without limit for paths that contain an ID. OBI carries a separate mechanism to avoid that. Give it route patterns in the configuration and it follows them; give it nothing and a heuristic takes over. The default heuristic runs each segment of the path through a classifier and replaces the ones it judges to be ID-like strings rather than meaningful words. Capping the number of distinct values per segment is another approach, but that one runs only when you select it explicitly in the configuration. This setup has only static paths, so /inventory and /order appear as they are.
The metric names are the names from the OpenTelemetry semantic conventions, converted to Prometheus form.
| Metric name | Content |
|---|---|
http_server_request_duration_seconds | Histogram of the duration on the server side |
http_client_request_duration_seconds | Histogram of the duration on the client side |
http_server_request_body_size_bytes | Size of the body that the server received |
http_client_response_body_size_bytes | Size of the body that the client received |
The same trace data also builds the call relationships between services. Switch Query type to “Service Graph” in Explore’s Tempo.
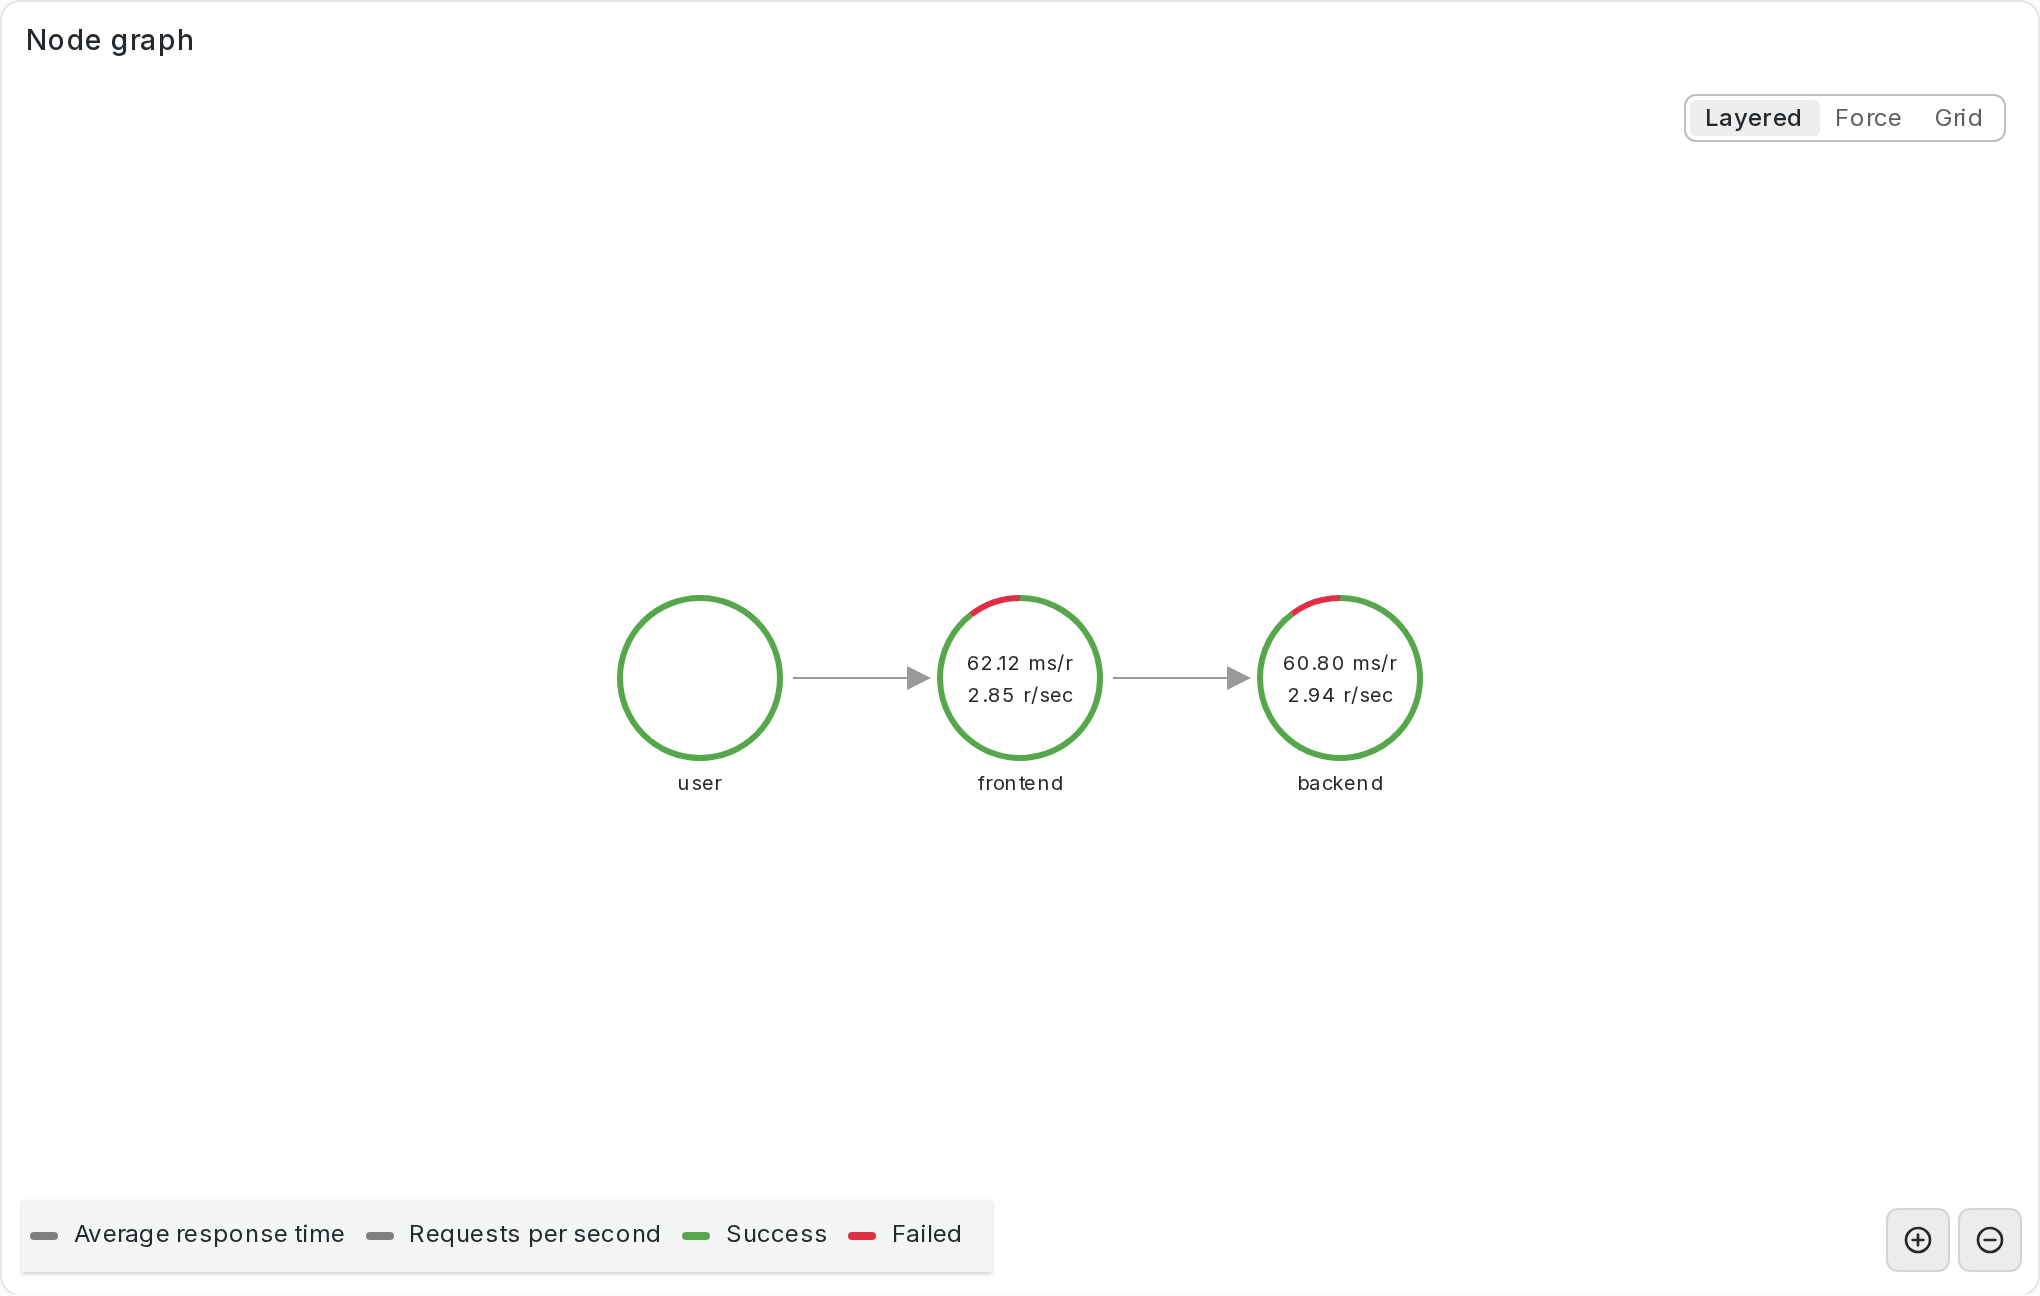 Figure 4: The arrows represent the direction of a call, from the caller to the callee. The color of the ring around each circle shows the ratio of success to failure, and the numbers inside show the duration and the requests per second.
Calls run from user to frontend, and from frontend to backend. Uninstrumented callers all collect under user. Tempo builds this graph from the parent-child relationships of the spans. Adding application_service_graph to OTEL_EBPF_METRICS_FEATURES makes OBI emit almost the same metrics itself, but that would duplicate them here, so I left it out.
Common stumbles
These are the ones I ran into while running this setup on my own machine.
When the instrumenting process line does not appear, suspect the target selection first. OTEL_EBPF_AUTO_TARGET_EXE takes exactly one glob. Two paths separated by a comma become one pattern, not two. "*/frontend,*/backend" matches neither path, and nothing gets instrumented, with no error to tell you. To select several executables, list them inside braces, as in "/{frontend,backend}". A leading wildcard causes no trouble on its own; "*/frontend" does match /frontend.
type=generic means that OBI did not decide that the binary is a Go binary. Check whether go version -m can read it, and whether readelf -S shows a .gopclntab. OBI has routed it to the language-independent one of the two paths from Chapter 8, so function-level instrumentation is not running.
When metrics do not appear in Prometheus, suspect the send interval. OTEL_EBPF_METRICS_INTERVAL is 15 seconds here, so the first series takes 15 seconds to appear. Remove the setting and the default of 60 seconds applies.
Enabling context propagation produces logs like these on some machines.
level=WARN msg="kernel misreports ioctl(FIONREAD) for sockets in a sockhash (kernel commit 929e30f93125, present in 6.6.128+, 6.12.75+, 6.18.14+ and 6.19+); enabling BPF compensation for tracked sockets" component=tpinjector
level=ERROR msg="context propagation is disabled: the BPF compensation is ineffective (attach failed or blocked?). This kernel misreports ioctl(FIONREAD) for sockets in a sockhash (kernel commit 929e30f93125), or could not be verified to report it correctly, so keeping propagation enabled would risk making applications sizing reads via FIONREAD stall or truncate transfers" component=tpinjector
Chapter 13 covers two propagation paths, and this log means that path 2, the one that uses sk_msg, is now off.
The 6.19+ in the log is OBI’s own notation. In the actual upstream stable series, the commit landed in 6.19.4 rather than 6.19.02. A distribution can backport it on its own, so judge your own machine by this startup check from OBI rather than by comparing version numbers.
Path 1, which writes into the application’s buffer with bpf_probe_write_user, keeps running. Propagation still works as long as backend can read Traceparent. The results in this chapter came from a machine that prints this log, and backend does receive Traceparent there. Path 1 cannot always write, though. It skips the write when the buffer has no room, or when it cannot resolve an offset that it needs, and in those cases path 2 being off is propagation failing outright.
On a machine where lockdown is [integrity], path 1 is the one you cannot use. Path 2 takes over where it works. When both are off, Traceparent stays empty, and traces connect only within the range that one OBI observes on both sides.
What this chapter contributes to the hurdles
| What you understood in this chapter | The hurdle behind it |
|---|---|
| Durations derived from the times at a function’s entry and exit | Hurdle 1 (Chapter 10). The standard way to record a function’s exit does not work in Go |
| The method, the URL, and the status code read out of the arguments | Hurdle 2 (Chapter 11). Arguments ride in registers, not on the stack |
| OBI knowing where each field sits inside a struct | Hurdle 3 (Chapter 12). The position changes with the version of Go and of the libraries |
Traceparent written without the application knowing | Hurdle 4 (Chapter 13). Carrying context across processes |
- OBI is an independent program outside the target process. It touches neither the application code nor the build.
- While one OBI watches both sides, traces connect without a written header. To carry the context outside the process, enable context propagation explicitly.
The feature is off by default because it rewrites the memory of another process. OBI leaves the decision to enable it to you. ↩︎
The changelogs for 6.19.1 through 6.19.3 do not list the commit, and the changelog for 6.19.4 records it as
[ Upstream commit 929e30f9312514902133c45e51c79088421ab084 ](ChangeLog-6.19.4). ↩︎