First published: Last updated:
What Is OBI?
Originally published in Japanese at https://zenn.dev/ymotongpoo/books/go-ebpf-primer/viewer/35-obi.
The previous chapter covered how eBPF works. This chapter introduces the subject of the book, OpenTelemetry eBPF Instrumentation (OBI): where it came from, how it works as a whole, and the two paths it takes to instrument a program. The hurdle chapters go into the details of OBI’s implementation, so the overall picture comes first.
Origins in Beyla
OBI grew out of Beyla, an eBPF-based auto-instrumentation tool that Grafana originally developed. Grafana announced the donation to the OpenTelemetry project in May 2025, and the first release, v0.1.0, came out on October 30 of that year. Releases continue at a pace of about one per month. Upstream places the project in Development: VERSIONING.md states that the user-visible surface is not yet stable, and that incompatible changes can land between minor versions of v0. Beyla did not disappear. It continues as Grafana’s distribution built on OBI. The mainline of development is on the OBI side, and Beyla’s maintainers now work in the OBI repository.
This book references v0.13.0, released on September 4, 2026. The repository is open-telemetry/opentelemetry-ebpf-instrumentation.
What OBI does
OBI is a program in its own right. Run it on the same machine or in the same container environment as the application you want to observe. It then finds the target processes and attaches eBPF programs to them. It extracts HTTP and gRPC traces and metrics without changing the target, then sends them to an OpenTelemetry backend. The application side needs no work at all. This is what the zero-code instrumentation of Chapter 1 amounts to in practice.
From startup to export, OBI goes through the following stages.
- Discovery: OBI scans
/procat intervals and lists the running processes and the ports that they hold open. It does not instrument every process. It selects only the ones that match the criteria that you give in the configuration, such as the executable path, the port number, or Kubernetes metadata. An eBPF helper also detects new port binds, which lowers the cost of the polling. - ELF analysis: OBI analyzes the target executable and decides its language and kind. For a Go binary, it takes the addresses of the functions that it wants to instrument from the symbol table and
.gopclntab. It takes the positions of struct fields from DWARF and the offset table. This stage puts to use all of the information that Chapter 4 showed an executable keeps. - Load and attach: OBI loads the compiled eBPF programs into the kernel, submits them to the verifier, and binds hooks such as uprobes to the addresses that the analysis produced.
- Event collection: Each time a hook fires, the eBPF program builds an event on the kernel side. It writes that event to a ring buffer, which is the hand-off point that the kernel and user space share. OBI’s user-space side reads from the buffer and assembles spans, one per request.
- Export: OBI attaches Kubernetes and container metadata to the spans and sends them to a trace backend over OTLP, OpenTelemetry’s standard protocol. It can expose metrics in Prometheus format as well as over OTLP.
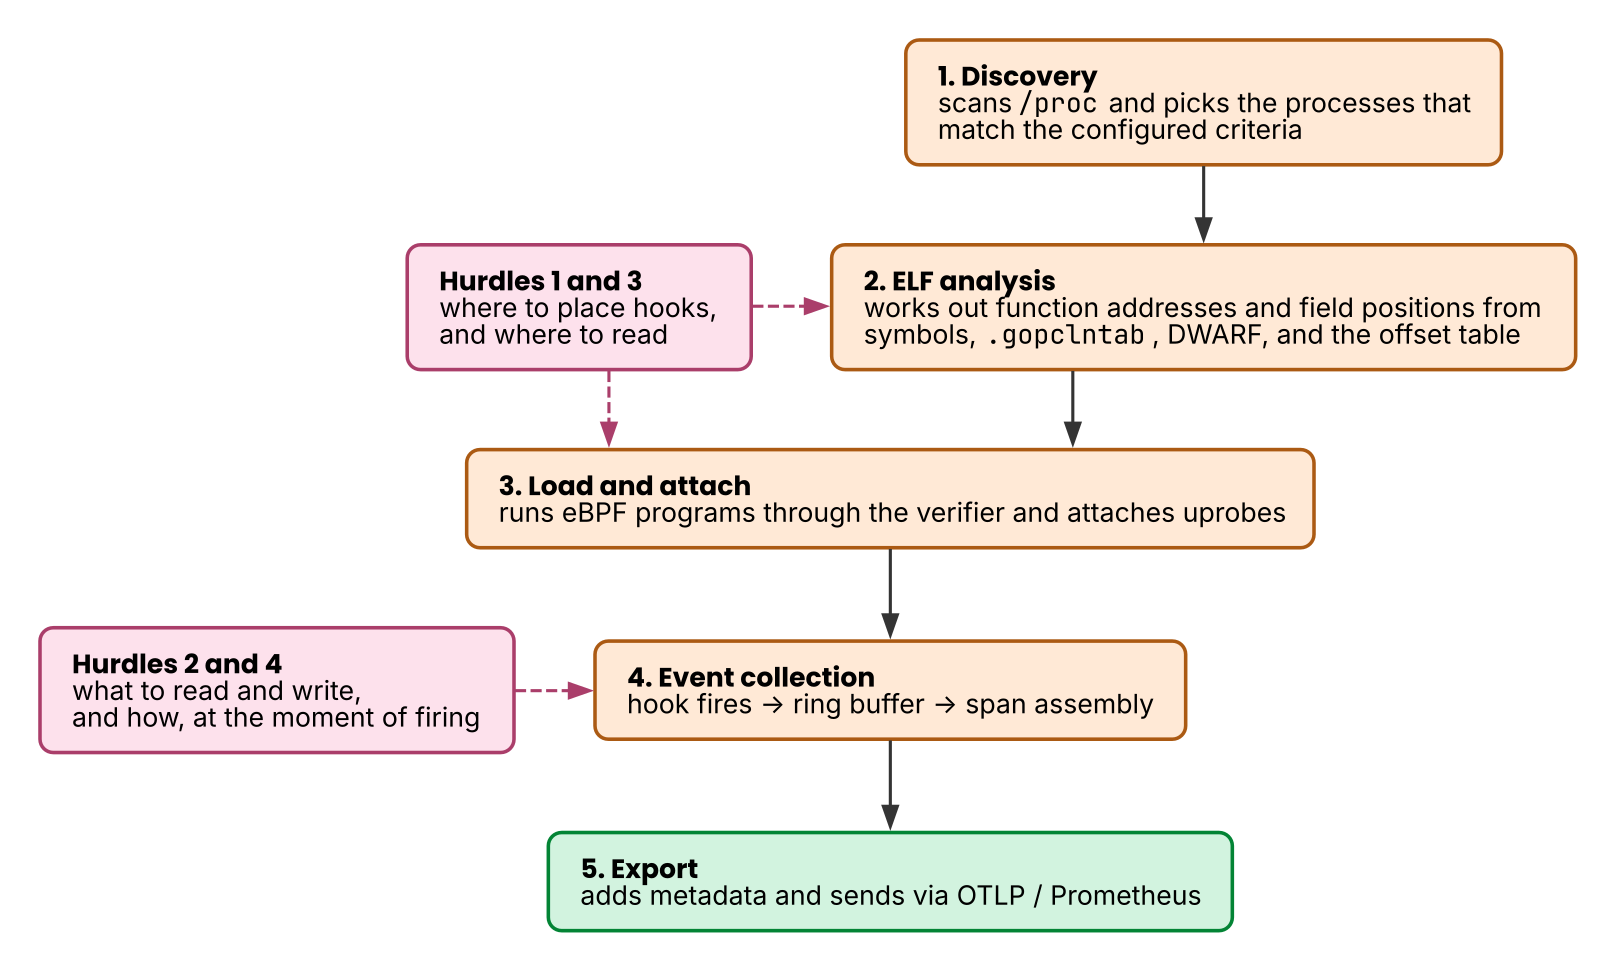 Figure 1: Solid arrows represent the flow of processing; dashed ones show which stage each note on the left refers to. Hurdles 1 and 3 appear mainly in the analysis and attach stages; Hurdles 2 and 4 appear in the event collection stage.
This figure also shows which parts the rest of this book covers. Hurdle 1 (uretprobe does not work) and Hurdle 3 (field offsets) are the difficulty of stages 2 and 3. Both come down to deciding where to place a hook and which memory to read. Hurdle 2 (the register ABI) and Hurdle 4 (context propagation) are the difficulty of stage 4. They arise the moment a hook fires, when OBI has to decide what to read or write, and how.
Where to run it
OBI runs only on Linux. It needs a kernel of version 5.8 or later with BTF enabled, and the permission to load eBPF programs. The easiest route is Docker: run otel/ebpf-instrument with --pid=host --privileged, and it observes the applications on the same host as they are. On Kubernetes, the usual shape is a DaemonSet, one instance per node. With hostPID: true, a single OBI observes every process on that node. A receiver also exists for embedding OBI in the OpenTelemetry Collector.
The next chapter covers the concrete configuration, and what you can see from it. For the exhaustive list of settings, see the official documentation.
The two instrumentation paths
OBI’s instrumentation falls into two categories, as SUPPORT_MATRIX.md lays out.
Network-level protocol instrumentation works independently of the application’s language. It places kprobes and socket filters on in-kernel socket processing such as connection establishment, sends, and receives. It then interprets the byte sequences that flow through as protocols including HTTP/1.1, HTTP/2, gRPC, MySQL, PostgreSQL, Redis, and Kafka. Whatever language you wrote the application in, OBI can observe it as long as the traffic passes through a socket. For traffic that TLS encrypts, OBI places uprobes on the functions of the OpenSSL shared library and reads the plaintext before encryption and after decryption.
Runtime- and library-level instrumentation needs a separate implementation for each target environment. Ruby, Python, and Node.js also get implementations that hook functions inside their runtimes to follow the context of execution. Instrumenting library-level functions with a uprobe, though, happens for Go alone. OBI fixes the range of support version by version: net/http and database/sql from Go 1.17, google.golang.org/grpc from 1.40. All four hurdles in this book arise on this second path.
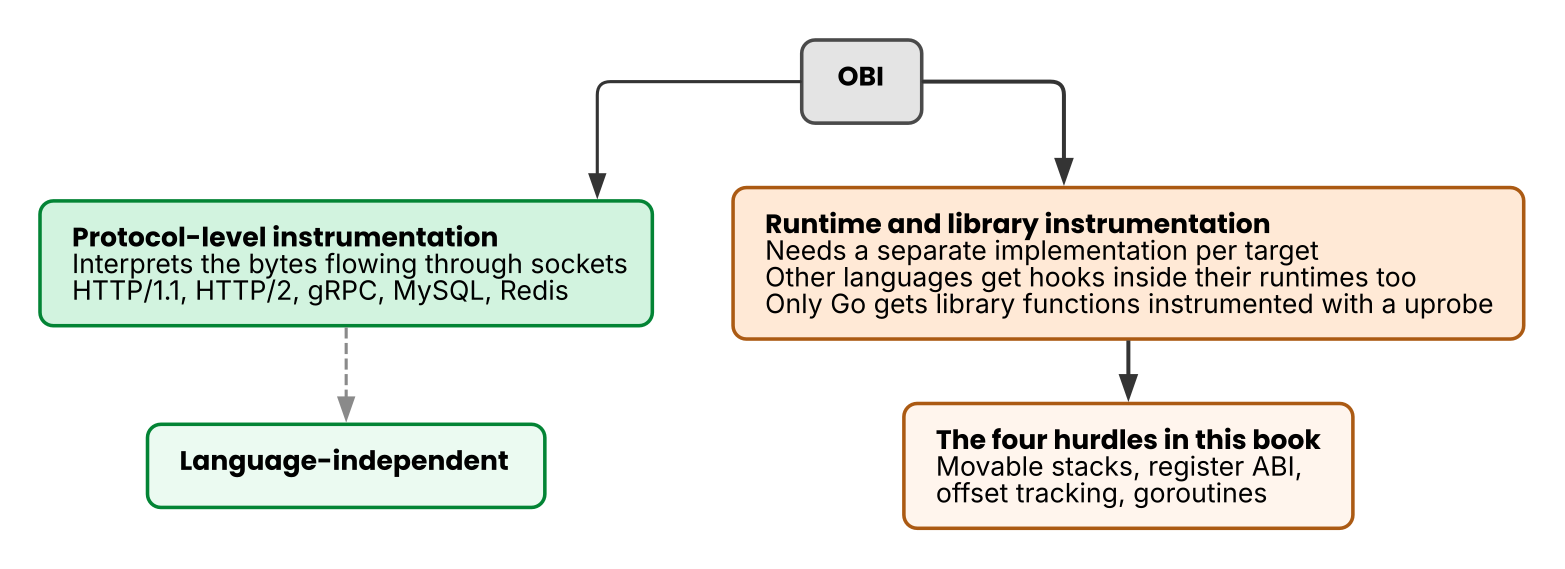 Figure 2: The arrows represent the branching of the classification. Protocol instrumentation is language-independent. Runtime- and library-level instrumentation requires a per-target implementation, and within it, reaching library functions with a uprobe happens for Go alone.
Protocol instrumentation alone can capture the elapsed time and the status code. OBI still goes down to the function level for Go because some information never appears on the socket. The socket shows nothing about the lineage of the goroutine that handles a request, which is Hurdle 4. And reading a value out of the struct before serialization gives you the exact value, with no protocol interpretation in between.
Repository layout
The hurdle chapters quote OBI’s source code repeatedly. The main areas of the repository are these.
| Location | Role |
|---|---|
bpf/ | C source for the eBPF programs that run on the kernel side |
bpf/gotracer/ | Function instrumentation of Go binaries (the main focus of this book) |
bpf/generictracer/ | Language-independent protocol instrumentation |
bpf/tpinjector/ | Header injection for context propagation (the second path in Hurdle 4) |
pkg/ | User-space Go code |
pkg/internal/goexec/ | ELF analysis of Go binaries and offset resolution (the main focus of Hurdles 1 and 3) |
pkg/ebpf/ | Loading and attaching eBPF programs, reading the ring buffer |
pkg/export/ | Export to OTLP and Prometheus |
cmd/obi/ | Entry point of the main binary |
The kernel side (C) is bpf/ and the user-space side (Go) is pkg/. Nearly every file that the hurdle chapters quote comes from bpf/gotracer/, pkg/internal/goexec/, or pkg/ebpf/.
What this chapter contributes to each hurdle
- OBI is a standalone program that runs as a pipeline: discovery → ELF analysis → load and attach → event collection → export.
- There are two instrumentation paths: language-independent protocol instrumentation, and runtime- and library-level instrumentation. Within the latter, reaching library functions with a uprobe happens for Go alone, and all four hurdles arise there.
- The kernel-side C code is in
bpf/, and the user-space Go code is inpkg/.