Viewing Claude Desktop and Codex App Telemetry in Grafana Cloud (June 2026)
Originally published in Japanese at https://zenn.dev/ymotongpoo/articles/20260617-ai-desktop-otel-grafana.
Introduction
In the previous article, I described how to send OpenTelemetry telemetry from the Claude Code CLI and Codex CLI on Linux to Grafana Cloud via Grafana Alloy. This time, I’ll summarize what I found when trying to do the same with the GUI apps on macOS (Claude Desktop and the Codex App).
TL;DR
The Codex App works with roughly the same steps as last time, but Claude Desktop is limited. I couldn’t find any OpenTelemetry settings for the GUI chat portion, but the Claude Code CLI launched as a “local code session” picks up the previous article’s configuration as-is.
OTel support in each app
| App | OTel support | Where to configure |
|---|---|---|
| Claude Desktop (chat UI) | No settings available | — |
| Claude Desktop’s local code sessions (the embedded Claude Code CLI) | Supported | The env block in ~/.claude/settings.json |
Codex App (app-server) | Supported | ~/.codex/config.toml (user level only) |
About Claude Desktop
Claude Desktop’s configuration file lives at ~/Library/Application Support/Claude/claude_desktop_config.json, and its main settings are limited to mcpServers (MCP server definitions) and preferences (display settings and the like) — there are no OTel-related settings to be found. The official OpenTelemetry configuration docs (Monitoring usage | Claude Code) are written for the CLI tool and contain no setup instructions for the Claude Desktop app.
On the other hand, Claude Desktop has a “local code session” feature that lets you run the Claude Code CLI from within the desktop app. In this mode, the Claude Code CLI starts up and reads the env block of ~/.claude/settings.json, so the OTel environment variables configured in the previous article work as-is. If you use code sessions inside the desktop app, no additional configuration is needed.
Configuring the Codex App
Set up OTel in ~/.codex/config.toml
The Codex App runs internally as codex app-server and reads the user-level ~/.codex/config.toml. The exact same [otel] section from the previous article’s Codex CLI setup works for the app too.
[otel]
environment = "production"
log_user_prompt = false
exporter = { otlp-http = { endpoint = "http://127.0.0.1:4318/v1/logs", protocol = "binary" } }
metrics_exporter = { otlp-http = { endpoint = "http://127.0.0.1:4318/v1/metrics", protocol = "binary" } }
trace_exporter = { otlp-http = { endpoint = "http://127.0.0.1:4318/v1/traces", protocol = "binary" } }
Restart the Codex App after configuring.
Only the user-level configuration takes effect
Even if you write an [otel] section in a project-level .codex/config.toml, app-server ignores it (openai/codex#17110). app-server reads only the user-level ~/.codex/config.toml. Since it shares the config file with the CLI, there’s no double bookkeeping, but be aware that putting it in the wrong place silently disables it.
Mode-specific limitations
As a known limitation, codex mcp-server emits no telemetry. There are also reports that codex exec emits no metrics (openai/codex#12913). The Codex App’s normal interactive sessions run as app-server, so they are covered. You can verify this with the method in the next section.
Adding the configuration to Alloy on macOS
If you don’t have Alloy installed, install it first. Homebrew is the easy way.
brew install grafana/grafana/alloy
On macOS, the configuration for a Homebrew-installed Alloy lives at /opt/homebrew/etc/alloy/config.alloy. The path differs from Linux (/etc/alloy/config.alloy), but the configuration syntax is the same. The config file is the same as the one from the previous article. The only change is how the API key is set.
otelcol.auth.basic "ai_grafana_cloud" {
    username = "<OTLP_INSTANCE_ID>"
    password = sys.env("GCLOUD_RW_API_KEY")
}
GCLOUD_RW_API_KEY is already set in /opt/homebrew/etc/alloy/config.env. The endpoint zone and OTLP instance ID can be found on Grafana Cloud’s Connections page.
Also, since deltatocumulative is experimental in Alloy, the startup options need --stability.level=experimental. On Linux I put it in CUSTOM_ARGS in /etc/default/alloy, but with the Homebrew version on macOS you write it to /opt/homebrew/etc/alloy/extra-args.txt as follows. The contents of this file are passed straight through as command arguments by the launch script (alloy-wrapper).
--stability.level=experimental
After saving extra-args.txt, restart Alloy.
brew services restart grafana/grafana/alloy
Verifying it works
After some interaction in the Codex App, check that OTLP is being received at Alloy’s HTTP endpoint.
$ curl -s http://localhost:12345/metrics | grep otelcol_receiver_accepted
otelcol_receiver_accepted_log_records_total{...} 42
otelcol_receiver_accepted_metric_points_total{...} 8
otelcol_receiver_accepted_spans_total{...} 15
If the counters are increasing, Alloy is receiving data. Confirm that the sender-side counters (otelcol_exporter_sent_*) are increasing as well. On the Grafana Cloud side, you can check with gcx.
$ gcx metrics series '{__name__=~"codex.*"}' --since 30m
Comparing App and CLI metrics with gcx
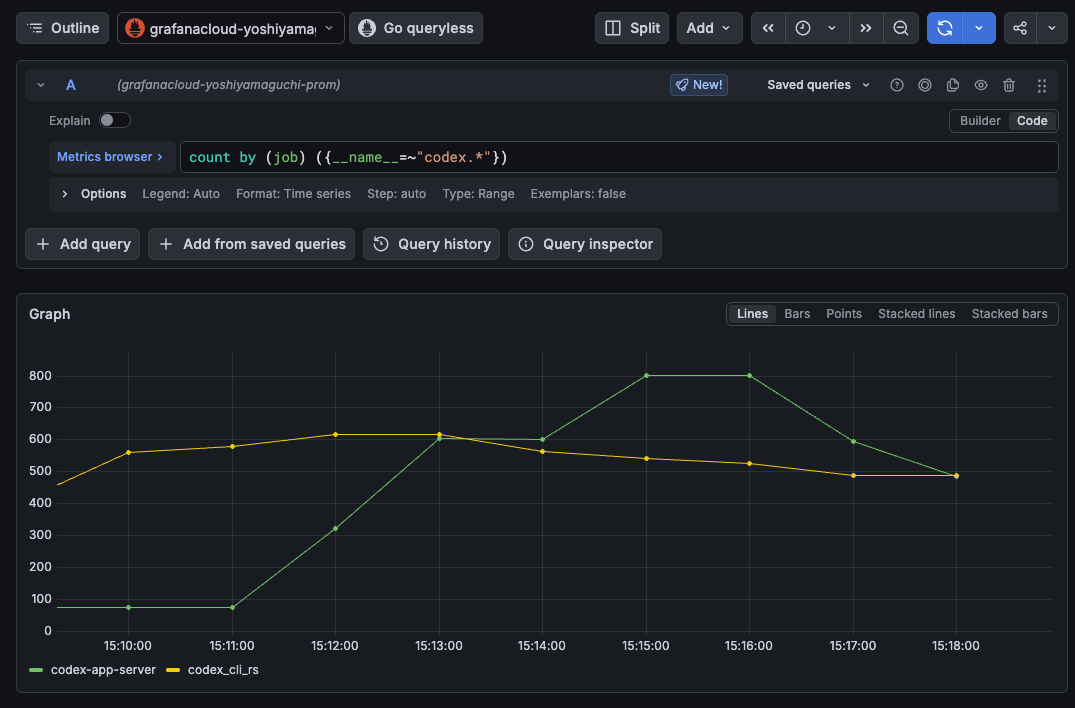
Even with the same [otel] configuration, the App (codex app-server) and the CLI (codex exec) send different metrics. The job label indicates the source, so that’s the first way to tell them apart.
$ gcx metrics series '{__name__="codex_turn_e2e_duration_ms_milliseconds_count"}' --since 24h --to now
{"__name__":"codex_turn_e2e_duration_ms_milliseconds_count","app_version":"0.139.0",
 "job":"codex_exec","model":"gpt-5.5","service_name":"codex_exec",...}
job="codex_exec" is the CLI and job="codex-app-server" is the App.
The CLI emits detailed turn-level native metrics such as codex_turn_* (turn latency and token usage), codex_conversation_turn_count_total, and codex_websocket_*. The App emits almost none of these native CLI metrics, but sends traces (spans) instead. Grafana Cloud’s metrics generation feature derives traces_spanmetrics_* metrics from the spans, so you can observe the per-turn internals in a different form.
$ gcx metrics query 'sum by (span_name) (increase(traces_spanmetrics_calls_total[1h]))'
{"metric":{"span_name":"generateText claude-opus-4-6"},"value":[...,"15"]}
{"metric":{"span_name":"plugin/list"},"value":[...,"57.2"]}
{"metric":{"span_name":"config/read"},"value":[...,"4.4"]}
{"metric":{"span_name":"thread/list"},"value":[...,"1.1"]}
...
generateText claude-opus-4-6 corresponds to the number of actual LLM calls. plugin/list shows a high count because the App periodically fetches the plugin list in the background.
You can inspect which metrics each source emits by filtering with gcx metrics series.
$ gcx metrics series '{job="codex-app-server"}' --since 24h --to now
$ gcx metrics series '{job="codex_exec"}' --since 24h --to now
This is also visible in Grafana’s Explore.
Summary
Codex yielded telemetry data surprisingly smoothly, but with Claude Desktop it turned out that session telemetry isn’t available. For Codex, the job label distinguishes the App from the CLI, which makes filtering easy when querying.