Viewing Claude Code and Codex CLI Telemetry in Grafana Cloud
Originally published in Japanese at https://zenn.dev/ymotongpoo/articles/20260616-ai-cli-otel-grafana.
Introduction
Hi, I’m a Developer Advocate at Grafana Labs.
Lately I’ve been running Claude Code and Codex CLI on my local machine almost every day. With this much usage, I started wondering: which models am I using and how much, what do my tokens and costs look like, and what are my turn latency and time to first token (TTFT)?
Fortunately, more and more recent AI coding agent CLIs support OpenTelemetry. So I actually tried sending the telemetry from three CLIs (Claude Code / Codex / Cursor CLI) to Grafana Cloud and visualizing it.
The bottom line: for Claude Code and Codex, I was ultimately able to send metrics, logs, and traces — all three — to Grafana Cloud. Along the way, though, I hit a trap where “all metrics get rejected because of delta temporality,” so I’m writing this up including the real-world pitfalls.
OpenTelemetry support in each CLI
Here’s what I found (as of June 2026).
| CLI | Native OTel support | Configuration | gen_ai.* compliance |
|---|---|---|---|
| Claude Code | Yes | Environment variables / the env block in settings.json. Metrics, logs, traces (beta) | claude_code.llm_request spans carry gen_ai.system / gen_ai.request.model and other attributes |
| Codex CLI | Yes | The [otel] section in ~/.codex/config.toml. Metrics, logs, traces | Currently uses its own codex.* naming and does not comply with the OpenTelemetry Gen AI semantic conventions |
| Cursor CLI | No | No first-party support (third-party hooks/MCP only) | - |
Cursor CLI has no native OTel support, and the third-party wrappers are unofficial and aimed at the IDE, so I skipped it this time. The rest of this article covers Claude Code and Codex.
Architecture
Grafana Cloud accepts OTLP/HTTP at its OTLP gateway (https://otlp-gateway-<zone>.grafana.net/otlp), so each CLI could send directly there.
For this project, though, I went with this setup.
Claude Code ─┐
             ├─→ 127.0.0.1:4318 (OTLP) ─→ Grafana Alloy ─(Basic auth)→ Grafana Cloud OTLP gateway
Codex ───────┘                            (only Alloy holds the token)
The reason is simple: I didn’t want to put the auth token in plaintext in each CLI’s config file. By inserting Alloy 1 as one hop, the token exists only in Alloy’s configuration, and everything on the CLI side can point at localhost with no authentication. Also, this machine was already sending various Linux host telemetry through Grafana Alloy, so that played into the decision too. Given all that, instead of standing up a new Collector, I could handle it by simply adding one OTLP receiver to the existing Alloy.
v1.11.3 → v1.17.0. Having a newer version is reassuring when using deltatocumulative, described later.CLI-side configuration
Claude Code
This goes in the env block of ~/.claude/settings.json. Since we’re sending to an Alloy running on the same host, the endpoint is localhost with no token.
{
  "env": {
    "CLAUDE_CODE_ENABLE_TELEMETRY": "1",
    "CLAUDE_CODE_ENHANCED_TELEMETRY_BETA": "1",
    "OTEL_METRICS_EXPORTER": "otlp",
    "OTEL_LOGS_EXPORTER": "otlp",
    "OTEL_TRACES_EXPORTER": "otlp",
    "OTEL_EXPORTER_OTLP_PROTOCOL": "http/protobuf",
    "OTEL_EXPORTER_OTLP_ENDPOINT": "http://localhost:4318",
    "OTEL_EXPORTER_OTLP_METRICS_TEMPORALITY_PREFERENCE": "cumulative"
  }
}
Setting CLAUDE_CODE_ENHANCED_TELEMETRY_BETA=1 enables traces (beta) in addition to metrics and logs. The span tree looks like claude_code.interaction → claude_code.llm_request → claude_code.tool, and llm_request spans carry attributes such as gen_ai.system, input_tokens / output_tokens, and ttft_ms.
The last line, OTEL_EXPORTER_OTLP_METRICS_TEMPORALITY_PREFERENCE=cumulative, is the countermeasure for the trap described later.
Codex CLI
This goes in the [otel] section of ~/.codex/config.toml.
[otel]
environment = "production"
log_user_prompt = false
exporter = { otlp-http = { endpoint = "http://127.0.0.1:4318/v1/logs", protocol = "binary" } }
metrics_exporter = { otlp-http = { endpoint = "http://127.0.0.1:4318/v1/metrics", protocol = "binary" } }
trace_exporter = { otlp-http = { endpoint = "http://127.0.0.1:4318/v1/traces", protocol = "binary" } }
Alloy-side configuration
Append an OTLP receiver and an exporter to Grafana Cloud to the existing /etc/alloy/config.alloy.
// Receive OTLP from local CLIs (Claude Code / Codex)
otelcol.receiver.otlp "ai_clis" {
	grpc { endpoint = "127.0.0.1:4317" }
	http { endpoint = "127.0.0.1:4318" }

	output {
		metrics = [otelcol.processor.deltatocumulative.ai_clis.input]
		logs    = [otelcol.exporter.otlphttp.ai_grafana_cloud.input]
		traces  = [otelcol.exporter.otlphttp.ai_grafana_cloud.input]
	}
}

// Convert delta temporality to cumulative (see below)
otelcol.processor.deltatocumulative "ai_clis" {
	output {
		metrics = [otelcol.exporter.otlphttp.ai_grafana_cloud.input]
	}
}

// Forward to the Grafana Cloud OTLP gateway
otelcol.exporter.otlphttp "ai_grafana_cloud" {
	client {
		endpoint = "https://otlp-gateway-<zone>.grafana.net/otlp"
		auth     = otelcol.auth.basic.ai_grafana_cloud.handler
	}
}

otelcol.auth.basic "ai_grafana_cloud" {
	username = "<OTLP_INSTANCE_ID>"
	password = "<GRAFANA_CLOUD_TOKEN>"
}
The token exists only inside this Alloy configuration. Use an access policy token with the metrics:write / logs:write / traces:write scopes.
Pitfalls I hit
Codex’s config.toml does not expand environment variables
The “Observability and telemetry” section of Codex’s official Advanced Configuration docs shows an example of referencing environment variables with ${VAR} in the [otel] headers, like headers = { "x-otlp-api-key" = "${OTLP_TOKEN}" }. Trusting this, I tried passing the token via an environment variable, but in practice (at least in codex-cli 0.139.0, which I tested) it was not expanded.
Testing against a local capture Collector, the auth header that arrived was literally Basic ${GRAFANA_OTLP_BASIC}. The ${...} was being sent as a plain string. The endpoint side also errored with invalid URI ${...}.
Fortunately, this design keeps the token only on the Alloy side, so the Codex config just needs to point at localhost with no auth, and this issue didn’t matter. You could also say the decision not to put tokens in CLI configs turned out to be the right call.
Only metrics get rejected with HTTP 400
Once I set everything up and ran it, traces and logs reached Grafana Cloud but every metric was rejected. Alloy’s logs showed this.
Exporting failed. Dropping data.
... rpc error: code = InvalidArgument desc = error exporting items,
request to .../otlp/v1/metrics responded with HTTP Status Code 400,
Message=otlp parse error: invalid temporality and type combination
for metric "codex.process.start"
... for metric "claude_code.cost.usage"
... for metric "claude_code.token.usage"
It says invalid temporality and type combination. To isolate the cause, I added an otelcol.exporter.debug config to the local Alloy and inspected the actual metrics, which looked like this.
-> Name: claude_code.cost.usage
-> DataType: Sum
-> IsMonotonic: true
-> AggregationTemporality: Delta
Both CLIs were sending metrics with delta temporality. Grafana Cloud’s metrics backend (Mimir) expects cumulative by default, so it was rejecting the delta Sums. To make matters worse, a single invalid metric in a batch causes the entire request to fail with a 400, so other metrics such as claude_code.cost.usage and claude_code.token.usage were being dropped as collateral damage.
Given that, I took the following approach.
- Claude Code: It supports the standard OTel environment variable
OTEL_EXPORTER_OTLP_METRICS_TEMPORALITY_PREFERENCE=cumulative, so add that tosettings.jsonto make it emit cumulative. - Codex: There’s no setting like Claude Code’s, and config.toml has no temporality option either, so as a workaround, insert
otelcol.processor.deltatocumulativeon the Alloy side to convert delta → cumulative.
deltatocumulative is considered experimental in Alloy, so you need to allow experimental features at service startup. I set this in /etc/default/alloy.
CUSTOM_ARGS="--stability.level=experimental"
After restarting Alloy with this, the metrics started being accepted. Checking Alloy’s self metrics, you can see otelcol_exporter_sent_metric_points_total increasing, send_failed at 0, and otelcol_deltatocumulative_datapoints_total converting data points.
deltatocumulative keeps the cumulative state for each series inside the Alloy process. Restarting Alloy resets the baseline, but increase() detects counter resets, so aggregation is unaffected.Not yet visible in AI Observability
Grafana Cloud has a feature called AI Observability. It adds dashboards and analysis features dedicated to AI agents, but as of June 2026, data from Claude Code and Codex CLI does not show up there.
AI Observability’s prebuilt dashboards assume the OpenTelemetry GenAI semantic conventions (gen_ai.*). They expect span names following the convention, like chat {model}, and metrics with conventional names like gen_ai.client.token.usage.
What the CLIs actually send, on the other hand, is:
- Claude Code: spans do carry attributes like
gen_ai.system, but span names areclaude_code.*and metric names areclaude_code.*— not the conventional names - Codex:
session_loopandcodex.*— not compliant with thegen_ai.*conventions at all
In other words, the data itself lands fine in Grafana Cloud’s stores (Mimir / Loki / Tempo) and can be queried normally from Explore, but it won’t appear in AI Observability’s dedicated panels as-is.
So this time I decided to build dedicated per-CLI dashboards that use claude_code.* / codex.* directly. For cost, tokens, sessions, TTFT, turn latency, and so on, this is the more straightforward way to visualize them.
Building dashboards with gcx
Grafana Cloud has a unified CLI called gcx. With it, you can first check the names the metrics are actually stored under. The OTLP→Prometheus translation appends suffixes, so claude_code.cost.usage ended up looking like this.
$ gcx metrics series '{__name__=~"claude_code.*|codex.*"}' --since 3h
claude_code_active_time_seconds_total
claude_code_cost_usage_USD_total
claude_code_session_count_total
claude_code_token_usage_tokens_total
codex_conversation_turn_count_total
codex_turn_token_usage_sum         # histogram (_sum/_count/_bucket)
codex_turn_ttft_duration_ms_milliseconds_bucket
codex_turn_e2e_duration_ms_milliseconds_bucket
...
You can see suffixes like _USD, _tokens, _seconds, and _total being appended. To make the dashboard queries robust against this suffix variability, I used regex matches on __name__.
# Token usage (by type)
sum by (type) (rate({__name__=~"claude_code_token_usage.*"}[$__rate_interval]))

# Cost (by model, USD/s)
sum by (model) (rate({__name__=~"claude_code_cost_usage.*"}[$__rate_interval]))
The interesting one was Codex: short codex exec runs don’t produce them, but interactive sessions do properly emit histograms for token usage, TTFT, tool call counts, and turn latency. Since these are histograms, you can write:
# TTFT p95
histogram_quantile(0.95,
  sum by (le) (rate(codex_turn_ttft_duration_ms_milliseconds_bucket[$__rate_interval])))

# Token usage (by token_type)
sum by (token_type) (rate(codex_turn_token_usage_sum[$__rate_interval]))
Dashboard JSON can be uploaded directly with gcx. The classic import endpoint uploads reliably.
$ gcx api /api/folders -d '{"title":"AI Coding Agents"}'
$ gcx api /api/dashboards/db -d @claude-code-cli.json
$ gcx api /api/dashboards/db -d @codex-cli.json
With that, dedicated dashboards for Claude Code and Codex are now sitting side by side in Grafana Cloud.
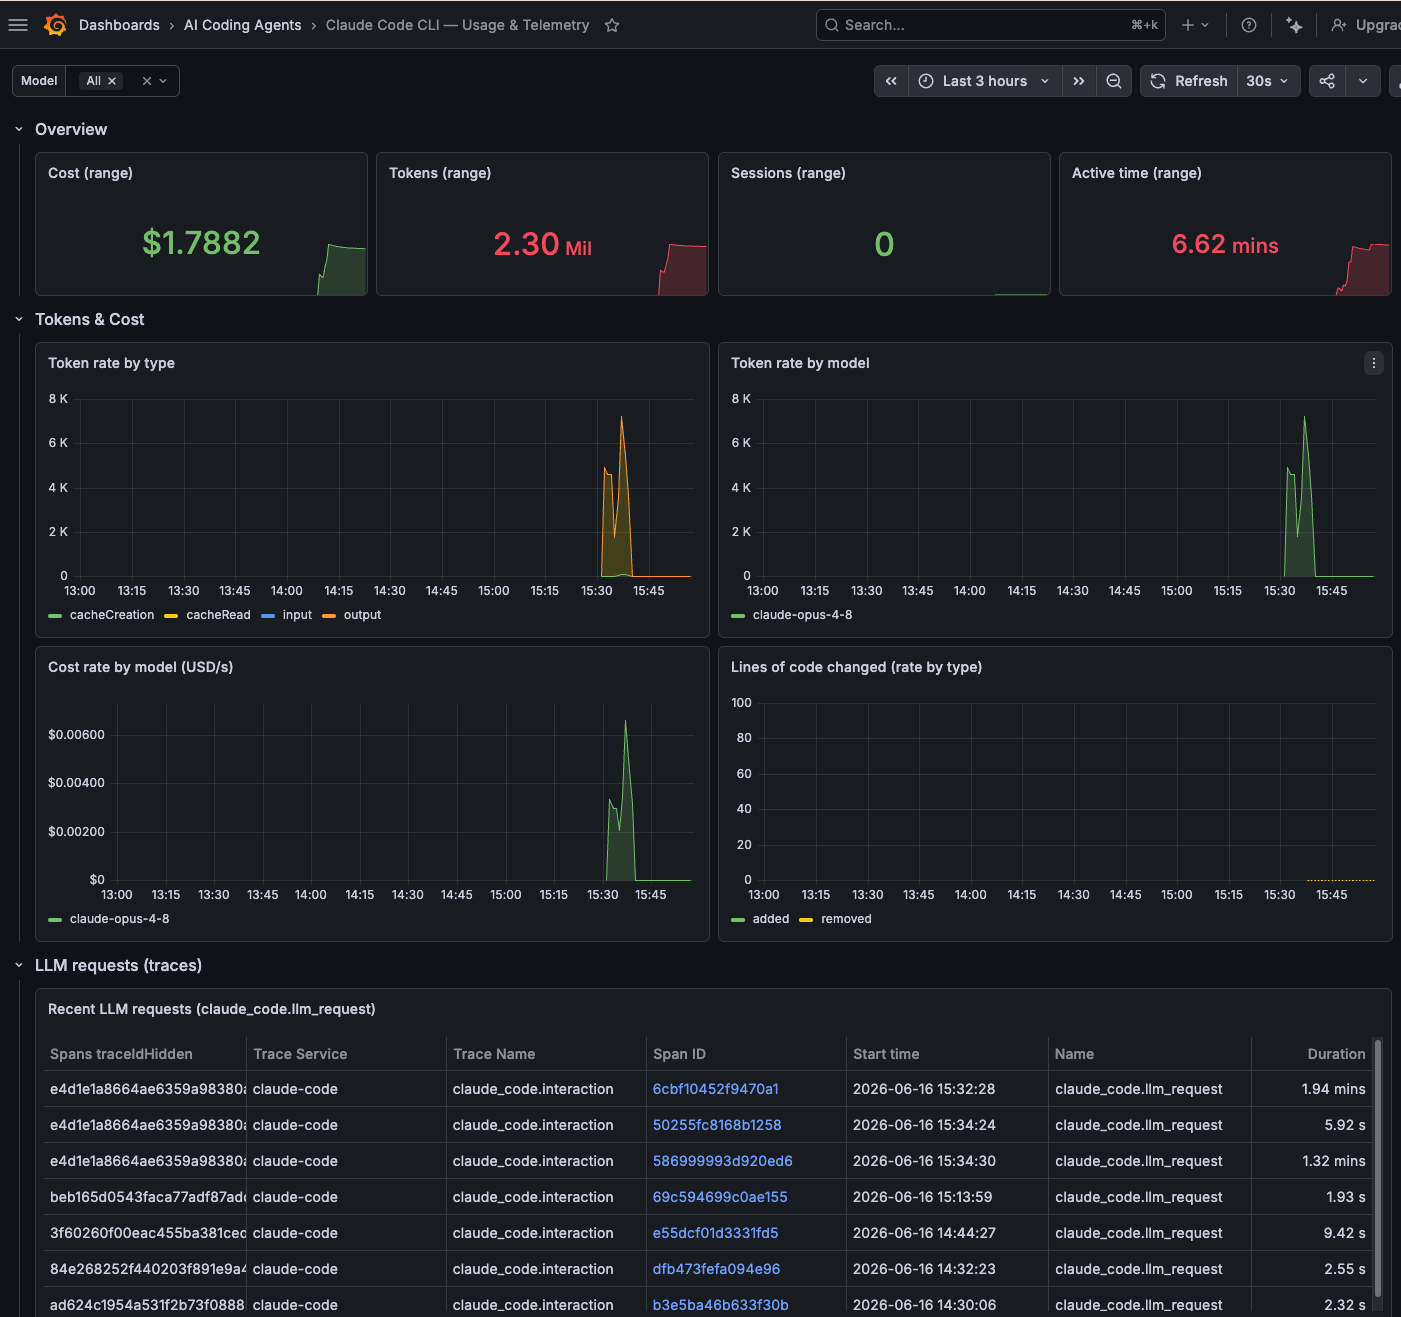
rate() / increase() need at least two samples inside the window. Panels may look empty right after a one-off run, but they fill in as you keep using the CLIs and samples accumulate.Summary
The key points of getting my local AI coding agent CLIs’ telemetry into Grafana Cloud were:
- Claude Code / Codex support OTel natively. Cursor CLI currently has no native support.
- To keep auth tokens out of CLI configs, inserting a local Grafana Alloy as one hop is convenient. You only need to add an OTLP receiver to an existing Alloy.
- Both CLIs send metrics with delta temporality. Mimir expects cumulative, so for Claude Code use
OTEL_EXPORTER_OTLP_METRICS_TEMPORALITY_PREFERENCE=cumulative, and for Codex convert with Alloy’sdeltatocumulativeprocessor. - The AI Observability app assumes the
gen_ai.*conventions, so the customclaude_code.*/codex.*telemetry won’t appear there as-is. The practical options are building dedicated per-CLI dashboards, or inserting a label transformation step to make the data conform to the conventions.
My takeaway: even when something says “OTel support,” the finer points of temporality and semantic conventions still take some extra work. That said, once the pipeline is in place, it’s genuinely fun to watch the cost and latency of your own AI usage in Grafana. I hope this helps anyone who wants to try the same thing.
I’m using Grafana Alloy here, but any OpenTelemetry Collector distribution with an OTLP receiver and an OTLP exporter will do. ↩︎