I Built a k6 Extension That Synthesizes Telemetry Data in OpenTelemetry Format
Originally published in Japanese at https://zenn.dev/ymotongpoo/articles/20260615-xk6-otel-gen-intro.
Introduction
Hi, I’m a Developer Advocate at Grafana Labs.
Whenever I want to test an observability platform, the perennial question is “how do I get realistic-looking telemetry?” Dashboard development, verifying Collector pipeline configurations, load testing backends, internal training — for all of these, standing up a real fleet of microservices is a lot of work.
This is half a personal gripe, but a demo of an observability product requires you to:
- Set up a reasonably complex system (the thing being monitored)
- Instrument that system
- Keep it running for a while so it generates a decent amount of telemetry
Only after all of that can you actually run the demo. For runtime products (serverless platforms, LLM model APIs, and so on), it can be as simple as:
- Build a container and deploy it
So I’ve often found myself thinking “must be nice.”
These days, AI coding agents make it much faster than it used to be to implement microservices, set up a Kubernetes cluster, and deploy everything. Even so, running microservices locally just for a demo is a hassle, and for a public demo you have to keep Kubernetes running on a cloud service, which costs money.
So I figured I might as well build a telemetry generator that makes it easy to create demos for observability SaaS products, and that became xk6-otel-gen.
As the name suggests, it’s a k6 extension. One look at the repository makes it obvious: I had an AI coding agent implement the whole thing. You declare the call relationships between services in YAML, and it synthesizes pseudo traces, metrics, and logs in OpenTelemetry format accordingly and sends them to an OTLP endpoint. Not a single real service is required.
In this article I’ll walk through what the tool is, from installation to your first simulation to fault injection.
How it works
The input to xk6-otel-gen is a single file called the “topology YAML.” It consists of three sections.
| Section | Role |
|---|---|
services | Defines services, their operations, and the call edges between operations |
journeys | A sequence of steps from the user’s perspective. One execution produces one trace |
faults | Fault scenarios such as error rate overrides or latency inflation (optional) |
Each time a journey is executed from the k6 script, the engine recursively traverses the edges and synthesizes spans according to the latency distributions (such as lognormal) and error rates. Metrics corresponding to the spans (latency histograms and request counts) and logs are generated at the same time, all correlated with the same trace context. To control load volume and concurrency, you can use k6’s native VU/duration/executor machinery as-is.
Prerequisites
| Tool | Version | Purpose |
|---|---|---|
| Go | 1.25 or later | Building the k6 binary with the extension |
| xk6 | Latest | Build tool for custom k6 binaries |
| Docker | Latest stable | Running the receiving OpenTelemetry Collector |
Installation
k6 extensions are used by building a k6 binary with the extension baked in, using a tool called xk61.
go install go.k6.io/xk6/cmd/xk6@latest
GOFLAGS="-buildvcs=false" xk6 build --with github.com/ymotongpoo/xk6-otel-gen
A k6 binary is generated in the current directory. Let’s verify that the extension is included.
$ ./k6 version
k6 v1.8.0 (go1.25.0, linux/amd64)
Extensions:
  github.com/ymotongpoo/xk6-otel-gen (devel), k6/x/otel-gen [js]
  github.com/ymotongpoo/xk6-otel-gen (devel), otel-gen [output]
If both the JavaScript API (k6/x/otel-gen) and the k6 output (otel-gen) are registered, you’re good to go.
Setting up a receiving Collector
As a first smoke test, we’ll use an OpenTelemetry Collector that simply prints whatever it receives to standard output. Save the following configuration as collector-config.yaml.
receivers:
  otlp:
    protocols:
      grpc:
        endpoint: 0.0.0.0:4317

exporters:
  debug:
    verbosity: normal

service:
  pipelines:
    traces:
      receivers: [otlp]
      exporters: [debug]
    metrics:
      receivers: [otlp]
      exporters: [debug]
    logs:
      receivers: [otlp]
      exporters: [debug]
Start it with Docker.
docker run --rm --name otel-collector -p 4317:4317 \
  -v "$PWD/collector-config.yaml:/etc/otelcol/config.yaml" \
  otel/opentelemetry-collector:latest
Writing a topology
Let’s model a classic three-tier setup (frontend → backend → database). Save the following YAML as topology.yaml.
namespace: demo
services:
  frontend:
    kind: application
    replicas: 2
    language: go
    framework: net/http
    version: 1.0.0
    operations:
      - name: get_index
        calls:
          - to:
              service: backend
              operation: get_user
            protocol: http
            latency:
              distribution: lognormal
              p50: 50ms
              p95: 150ms
            error_rate: 0.01

  backend:
    kind: application
    replicas: 3
    language: java
    framework: spring-boot
    version: 2.5.0
    operations:
      - name: get_user
        calls:
          - to:
              service: database
              operation: select_user
            protocol: grpc
            latency:
              distribution: lognormal
              p50: 20ms
              p95: 80ms
            error_rate: 0.005

  database:
    kind: database
    replicas: 1
    language: c
    framework: postgresql
    version: "16.4"
    operations:
      - name: select_user

journeys:
  checkout:
    weight: 1.0
    steps:
      - service: frontend
        operation: get_index
The key points are:
callsare the call edges. Specifying p50/p95 inlatencygenerates span durations that follow that distributionerror_rateis the base probability that the edge failsjourneys.checkoutstarts atfrontend.get_index, and the engine recursively follows thecallsfrom there
Writing the k6 script
With the service topology defined, the next step is the scenario. You describe journeys as a k6 script. As an example, save the following as script.js.
import { sleep } from "k6";
import otelgen from "k6/x/otel-gen";

export const options = {
  vus: 5,
  duration: "30s",
};

export function setup() {
  otelgen.configure({
    endpoint: "localhost:4317",
    protocol: "grpc",
    insecure: true,
  });
}

export default function () {
  const topology = otelgen.load("./topology.yaml");
  topology.runJourney("checkout");
  sleep(1);
}

export function teardown() {
  const stats = otelgen.stats();
  console.log(`traces exported: ${stats.tracesExported}, failed: ${stats.tracesFailed}`);
}
There’s one thing to watch out for in this structure: call otelgen.load() inside the default function. In k6, the return value of setup() is JSON-serialized and passed to each VU, so if you return the handle from load() out of setup(), its methods get lost. load() reads and validates the file only once for the whole test and just returns the cached handle on subsequent calls, so there’s no overhead in calling it every iteration.
otelgen.configure(), on the other hand, can only be called once per test, so the standard practice is to put it in setup().
Running it
./k6 run script.js
When the run finishes, the extension’s native metrics show up in the k6 summary.
  █ TOTAL RESULTS

    CUSTOM
    otel_gen_logs_exported......: 2175 72.439099/s
    otel_gen_metrics_exported...: 790  26.311213/s
    otel_gen_queue_drops........: 0    min=0       max=0
    otel_gen_traces_exported....: 2175 72.439099/s

    EXECUTION
    iteration_duration..........: avg=1s min=1s med=1s max=1s p(90)=1s p(95)=1s
    iterations..................: 150  4.9958/s
With 5 VUs × sleep(1), that’s about 5 journeys per second, so 150 traces were sent over 30 seconds. As long as otel_gen_traces_failed and otel_gen_queue_drops aren’t climbing, all exports succeeded.
Looking at the Collector’s logs, you can see the synthesized spans arriving. Three spans sharing the same trace ID form the frontend → backend → database call hierarchy.
frontend.get_index 6c9c90ecbfaf5145e11cc1ddcb0ad833 f4481f2b827b88a7
  http.request.method=GET http.route=/get_index service.name=frontend
  http.response.status_code=200
backend.get_user 6c9c90ecbfaf5145e11cc1ddcb0ad833 63bd3f571b5a2707
  http.request.method=GET http.route=/get_user service.name=backend
  http.response.status_code=200
database.select_user 6c9c90ecbfaf5145e11cc1ddcb0ad833 c269c33853246e6b
  db.operation.name=select_user db.system=postgresql server.address=database
  server.port=5432 service.name=database
Attributes such as http.* and db.* are set according to the OpenTelemetry semantic conventions, so service graphs and span metrics work naturally in backends like Grafana Tempo and Jaeger.
Injecting faults
What you really want to see when testing an observability platform is “what things look like when something goes wrong.”
Let’s add a faults section to the end of topology.yaml.
faults:
  # Inflate the latency of backend.get_user by 5x with 30% probability
  - target: operation:backend.get_user
    kind: latency_inflation
    severity:
      probability: 0.3
      multiplier: 5.0
  # Override the error rate of the frontend→backend edge to 20%
  - target: edge:frontend.get_index->backend.get_user
    kind: error_rate_override
    severity:
      probability: 1.0
      value: 0.2
Targets can be specified at three granularities — node:<service> (an entire service), operation:<service>.<operation> (a single operation), and edge:<from>.<op>-><to>.<op> (a single edge) — and four kinds of faults are available: latency_inflation, error_rate_override, disconnect, and crash.
Rerun with the same command, and error spans and logs start flowing into the Collector.
backend.get_user 3aa55a50cad0d8034dd74a72813b9cf2 a603a448031baf6c
  http.request.method=GET http.route=/get_user service.name=backend
  http.response.status_code=500 error.type=http.500
get_user failure exception.type=ServerError
  exception.message=simulated failure: http.500 on get_user
  outcome=failure error.type=http.500 service.name=backend
Error spans carry http.response.status_code=500 and error.type. In Grafana Tempo, you can likewise confirm from the traces that 5xx errors occurred.
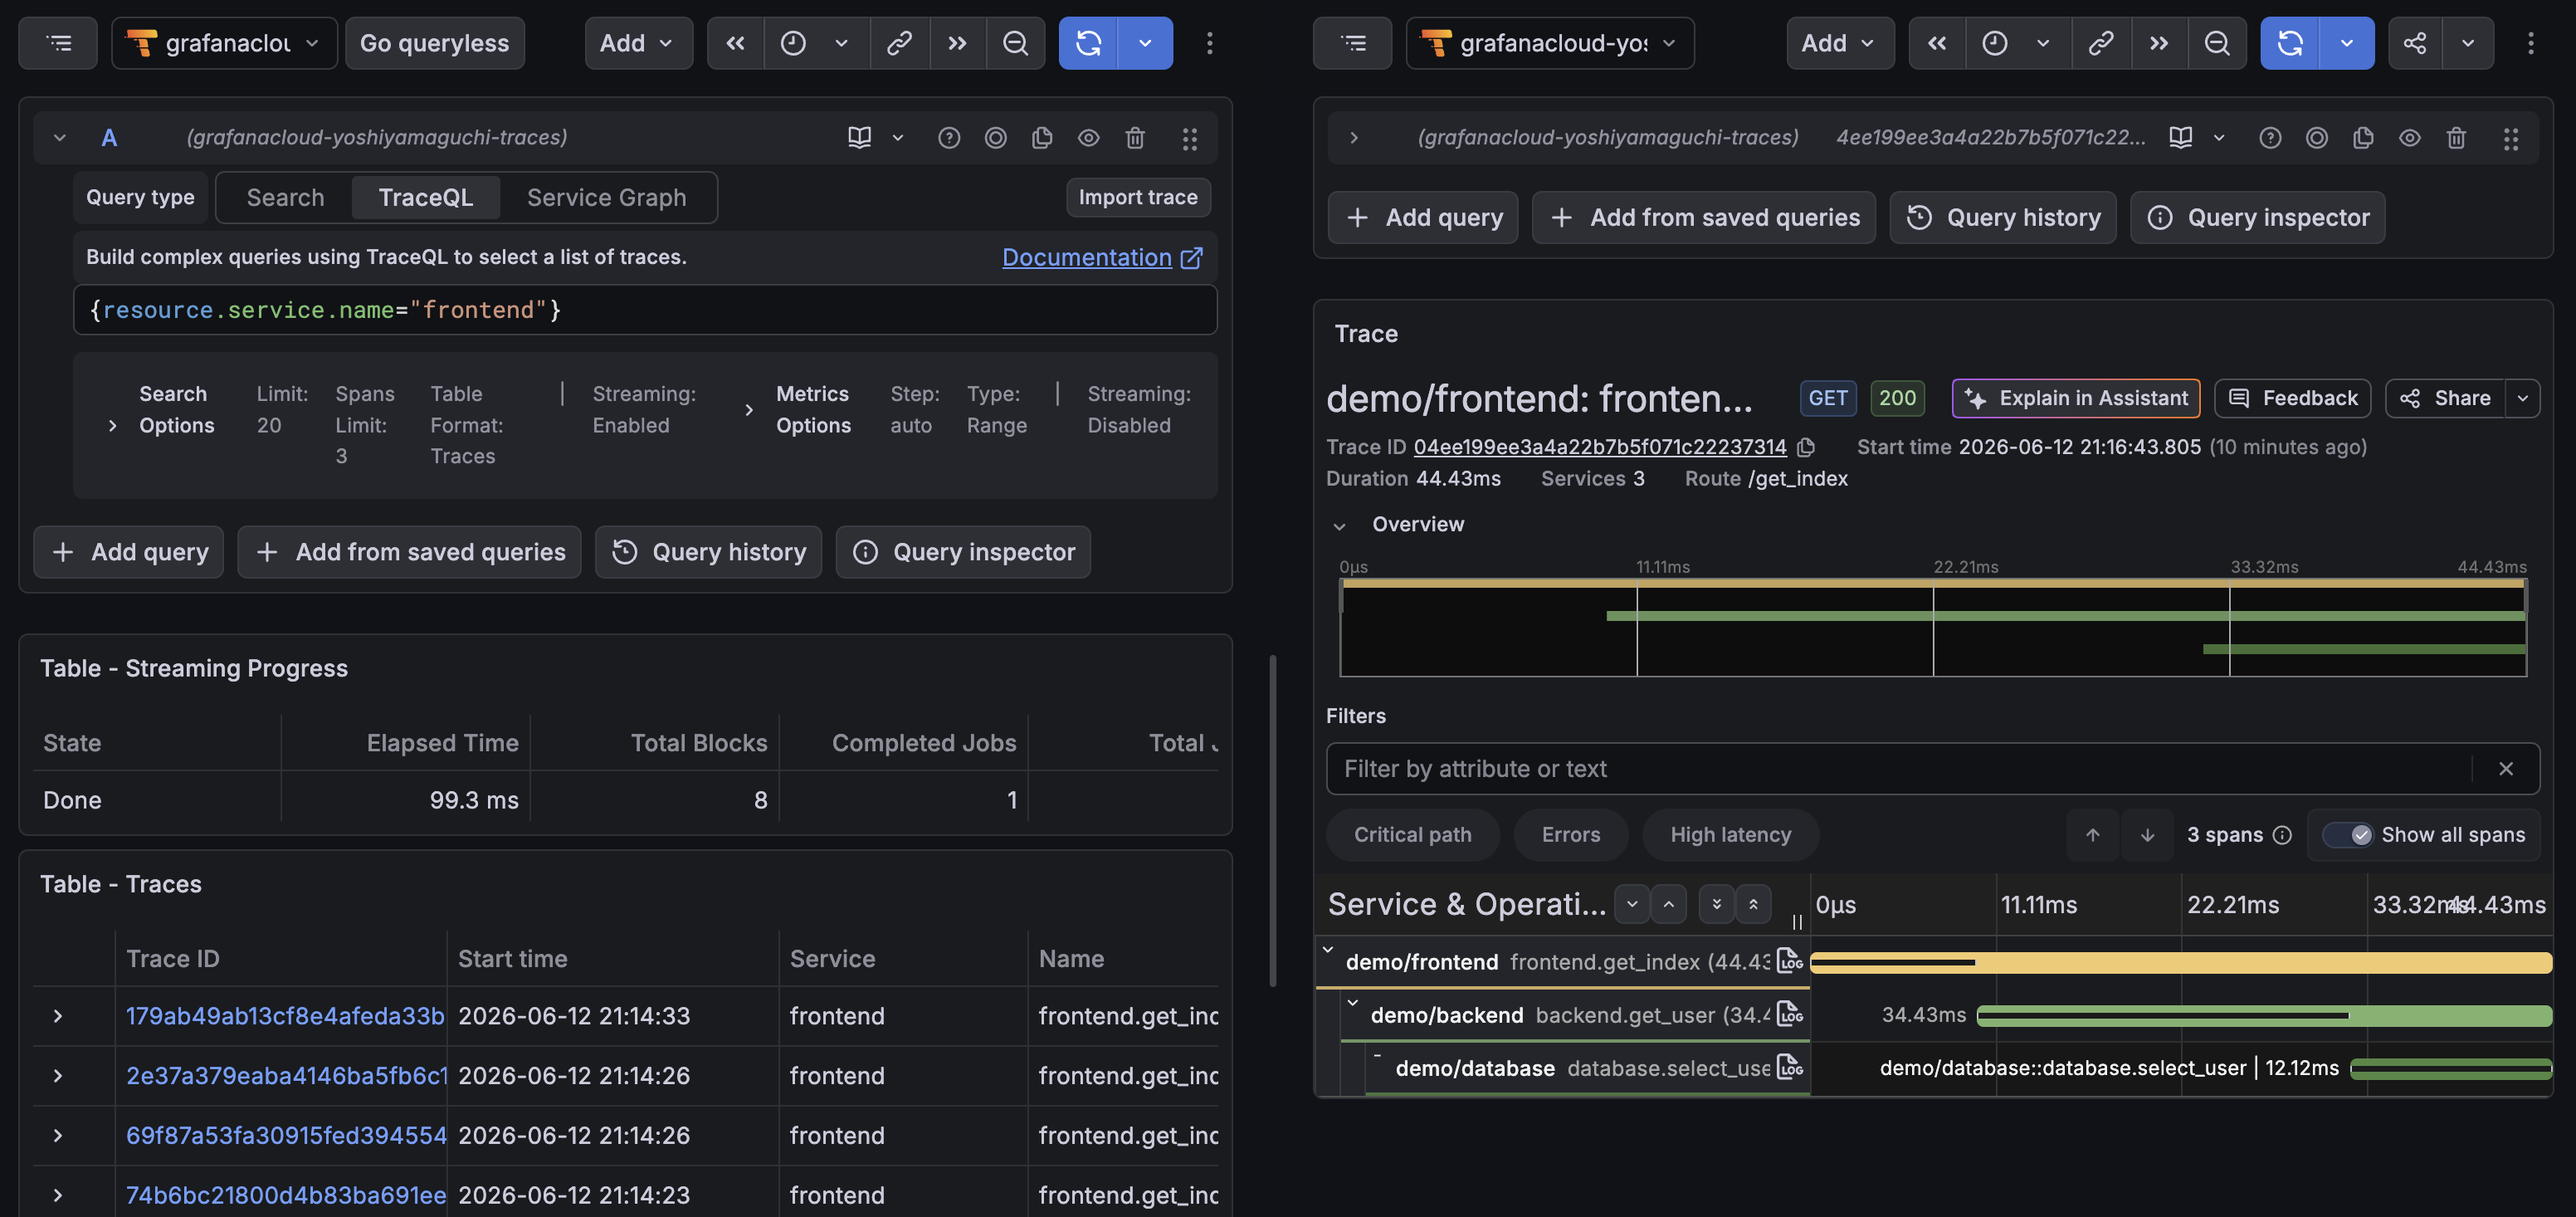
The corresponding logs are annotated with exception.type / exception.message. Verifying alert rules and error-rate dashboards now takes nothing more than editing a few lines of YAML.
Configuration precedence and the output extension
OTLP connection settings can be provided through more than just the JS API. The precedence is as follows (highest first).
| Priority | Source | Example |
|---|---|---|
| 1 | JS API | otelgen.configure({ endpoint: "localhost:4317" }) |
| 2 | --out argument | --out otel-gen=endpoint=localhost:4317,protocol=grpc |
| 3 | Environment variables | OTEL_EXPORTER_OTLP_ENDPOINT=http://localhost:4318 |
| 4 | Defaults | localhost:4317, gRPC |
Using --out otel-gen=... forwards k6’s own execution metrics to the same OTLP endpoint alongside the synthesized telemetry.
You can also omit configure() in the script and switch destinations from the command line alone.
./k6 run script.js \
  --out otel-gen=endpoint=localhost:4317,protocol=grpc,insecure=true
TLS (caCert/clientCert/clientKey), authentication headers, samplers (always_on/always_off/traceidratio), batch sizes, and more can also be specified via configure().
Examples of sending to managed OTLP endpoints like Grafana Cloud are collected in examples/saas-endpoints.md.
Closing thoughts
I only just started building this on a whim, and I keep finding bugs as I try things out, but as a pet project it already seems genuinely usable and I’m enjoying it so far. Beyond its original purpose, I have a feeling it could support some fairly practical use cases too, so I plan to try various things while growing the tool.
For those who are interested, a note on how I’m running it as an OSS project. It’s published under the Apache License 2.0, but I’m a bit worn out by AI slop at work, so I won’t be accepting pull requests for the time being. Instead, use case proposals and clear bug reports are welcome. This is a tool I develop on the side, and I delegate all implementation to AI. That makes detailed reports important, so the issue templates are fixed.
I don’t know yet how I’ll extend its features or keep maintaining it, but I’d like to tend it like a bonsai.
The reason for
-buildvcs=falsehere is that starting with Go 1.25, builds spanning multiple environments (such as directories that aren’t git repositories) are no longer possible, so it’s turned off as a workaround required by how xk6 works. For security reasons, you normally shouldn’t turn it off. ↩︎